
Most marketing performance issues aren’t caused by big failures—they come from small breakdowns across channels.
- Social media drives reach, not conversions—engagement is dropping, and discovery is shifting inside platforms.
- SEO still dominates, but most content gets no traffic unless it’s fast, clear, and genuinely useful.
- Email remains the highest-converting channel, especially through triggered and lifecycle campaigns—not blasts.
- E-commerce growth depends on removing friction, not adding features—checkout issues, trust gaps, and hidden costs kill conversions.
- Mobile is make-or-break, where speed and simplicity directly impact revenue.
- Marketing is shifting toward privacy-first, first-party data, and creative quality over targeting hacks.
👉 The takeaway:
You don’t need more channels or tools—you need to fix friction, move faster, and optimize what’s already underperforming.
Most marketing decisions don’t come down to one big insight.
They come from a bunch of small signals lining up, spending shifting, engagement dropping, conversion rates holding or slipping in ways that don’t feel obvious at first.
The stats in this list are those signals.
Some will confirm what you’re already seeing. Others will explain why something isn’t working the way it used to. A few might change what you focus on next.
Social Media Marketing Stats: High Reach, Low Conversion (The Growing Gap)
Social still drives discovery. But discovery doesn’t mean conversion.
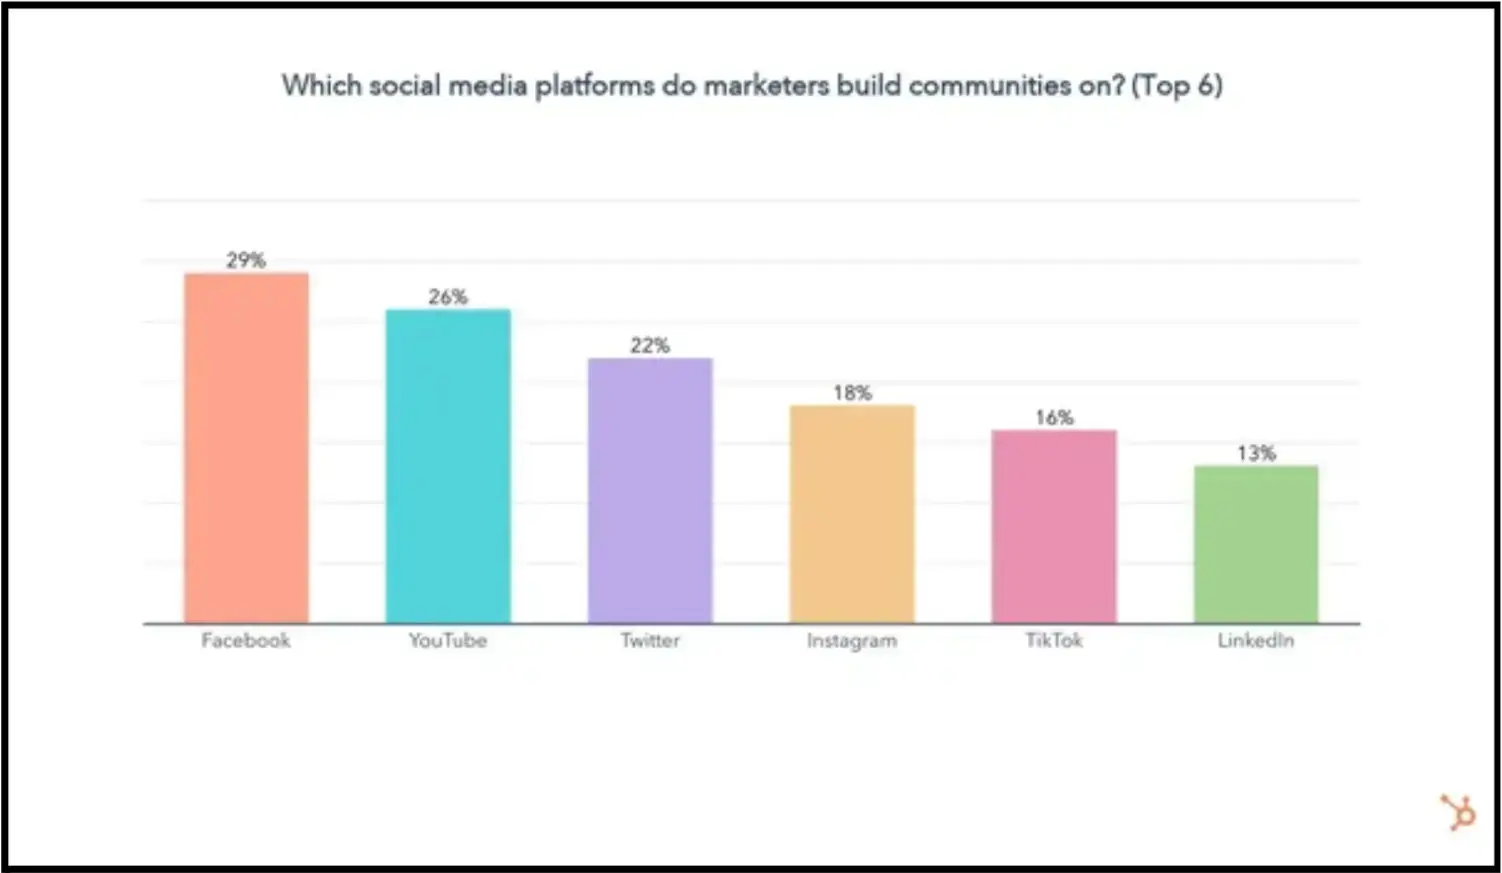
Source: HubSpot
The gap between those two is where most effort gets wasted.
- 5.04 billion people use social media globally (62.3% of the world). DataReportal
- People spend an average of 2 hours 23 minutes per day on social platforms. That’s not light usage. That’s default attention. DataReportal
- Facebook has 3.07 billion monthly active users. Meta IR
- Instagram has 2 billion+ monthly active users. CNBC
- TikTok surpassed 1 billion monthly active users. TikTok Newsroom
- YouTube reaches 2+ billion logged-in monthly users. Reach isn’t the constraint anymore. Getting noticed is. YouTube Press
- YouTube Shorts sees 50 billion daily views. The Verge
- LinkedIn now has 1 billion members. LinkedIn Newsroom
- Pinterest reported 482 million MAUs. Pinterest IR
- Snapchat reached 422 million daily active users. Snap IR
- Reddit reported 73 million daily active users. SEC S-1
- Threads hit 100 million signups in five days. New surfaces keep appearing. Attention doesn’t expand at the same rate. The Verge
- Median TikTok engagement rate: 2.30%. Rival IQ 2024
- Median Instagram engagement rate: 0.47%. Rival IQ 2024
- Median Facebook engagement rate: 0.06%. The drop-off across platforms is sharp. Format and context matter more than distribution. Rival IQ 2024
- 76% of consumers expect a response from brands within 24 hours. Sprout Social
- 63% say brands that respond are more memorable. Response speed isn’t supported anymore. It’s part of brand perception. Sprout Social
- 40% of young people use TikTok or Instagram for search when looking for places to eat. Search behaviour is shifting inside feeds, not just search engines. TechCrunch
- The influencer marketing industry is projected to be $24 billion in 2024. Influencer Marketing Hub
- Instagram Reels drive the highest reach rate, while carousels often drive stronger engagement. Socialinsider
- WhatsApp Business surpassed 200 million monthly users. Formats are splitting: one for reach, another for engagement. Treat them differently. Meta
SEO & Content Marketing Stats: Visibility Comes from Clarity, Not Volume
Search still begins most online experiences. Content that solves real problems, smoothly and quickly, wins.
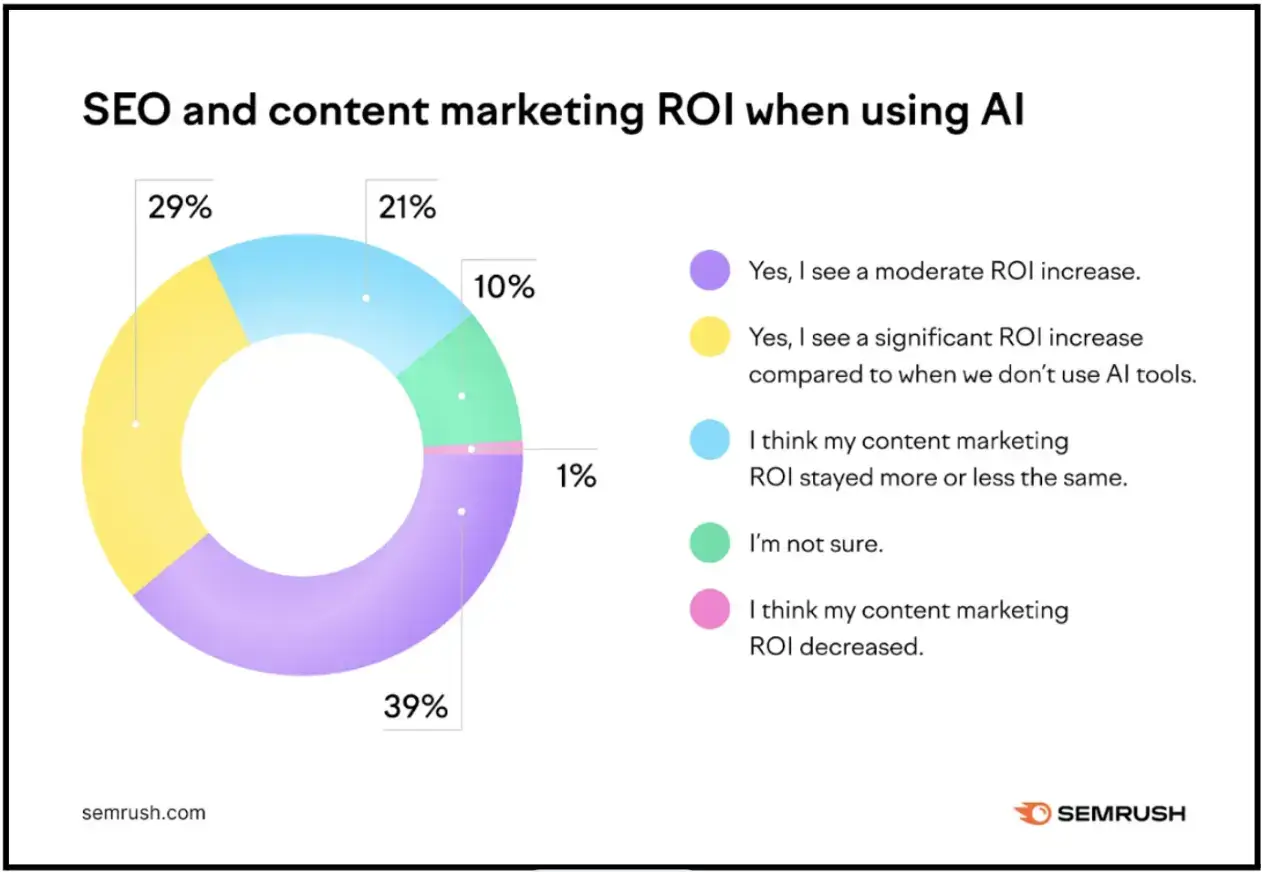
Source: Semrush
- Google holds 91%+ of the global search engine market share. StatCounter
- About 15% of Google searches each day are new. Google
- The top organic result in Google gets an average CTR of 27.6%. Backlinko
- 90.63% of content gets no traffic from Google. Ahrefs
- Featured snippets appear on roughly 19% of SERPs. Ahrefs
- 68% of online experiences begin with a search engine. BrightEdge
- 51% of smartphone users discover new companies or products via search. Think with Google
- A 0.1s improvement in mobile site speed can lift retail conversions by 8.4%. Think with Google/Deloitte. Quality hosting is one of the fastest ways to get there — better server response times mean faster pages without touching a single line of code.
- Republishing and optimizing old blog posts can increase organic traffic by 106%. HubSpot
- 91% of businesses use video as a marketing tool. Wyzowl
- 89% of people say watching a video convinced them to buy a product or service. Wyzowl
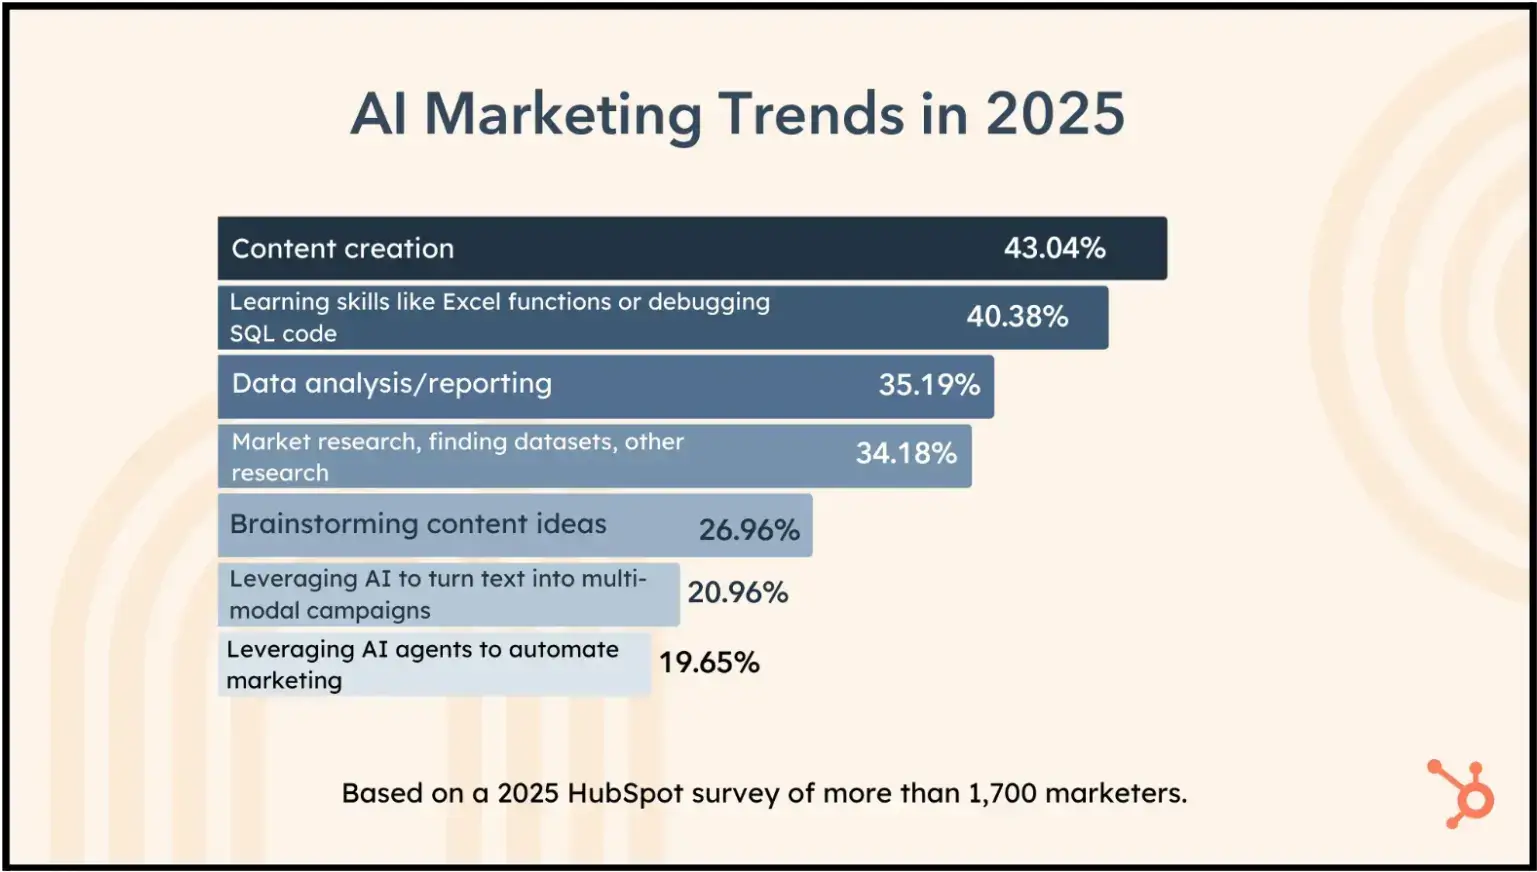
- 64% of marketers say they already use AI in their workflows. HubSpot
- The average blog post length hovers around the 1,400–1,500 word range among successful blogs. Orbit Media
- Bloggers who update older content are more likely to report strong results. Orbit Media
- Podcasts reach 42% of Americans monthly and 31% weekly. Edison Research, Infinite Dial 2024
- YouTube is the world's second-most-visited website. Similarweb
Gavin Yi, CEO & Founder of Yijin Solution, works with engineering teams sourcing custom parts where decisions depend on specifications, tolerances, and supplier reliability.
Email Marketing Stats: Where Conversions Actually Happen
Email still carries most of the conversion load, because it shows up when people are already close to acting.
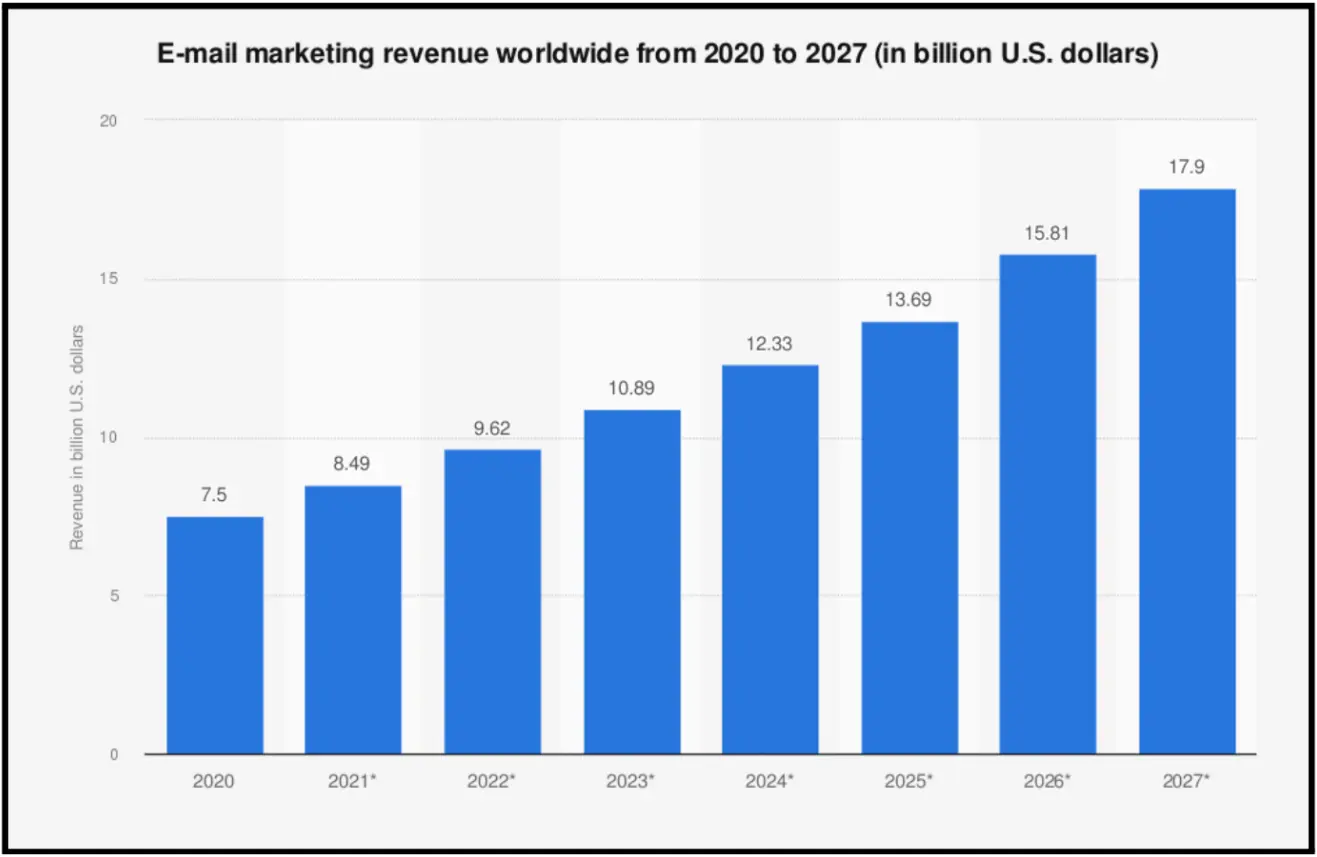
Source: HubSpot
- Email returns $36 for every $1 spent. This is what keeps it relevant. It’s not a discovery channel. It’s where decisions get finished. Litmus
- Average open rate: 21.5%. Campaign Monitor
- Average click-through rate: 2.3%. Campaign Monitor
- Average click-to-open rate: 10.5%. Campaign Monitor
- Average unsubscribe rate: 0.17%. These numbers look stable across industries. What changes is where you fall relative to them. If opens are fine but clicks are low, it’s usually a message problem. If both are low, it’s often targeting or timing. Campaign Monitor
- Triggered emails outperform one-size-fits-all campaigns. Epsilon
- Personalised subject lines can increase opens by 26%. This is less about personalisation as a tactic, more about sending something when it actually makes sense to the person receiving it. Experian
- Apple Mail Privacy Protection skews open rates, with Apple clients driving most opens. Open rates are no longer reliable indicators. Useful for troubleshooting. Not for judging performance. Litmus
- Welcome emails consistently deliver some of the highest engagement. This is one of the few points where people are paying attention by default. If it’s generic, that attention drops quickly. Campaign Monitor
- Abandoned cart emails remain one of the highest-ROI automations. These work because the decision is already partially made. What matters is removing whatever stopped it the first time. Omnisend
One place where this shows up clearly is in health-related purchases.
That’s exactly where lifecycle messaging matters. Not to push the decision, but to remove hesitation when someone is already close.
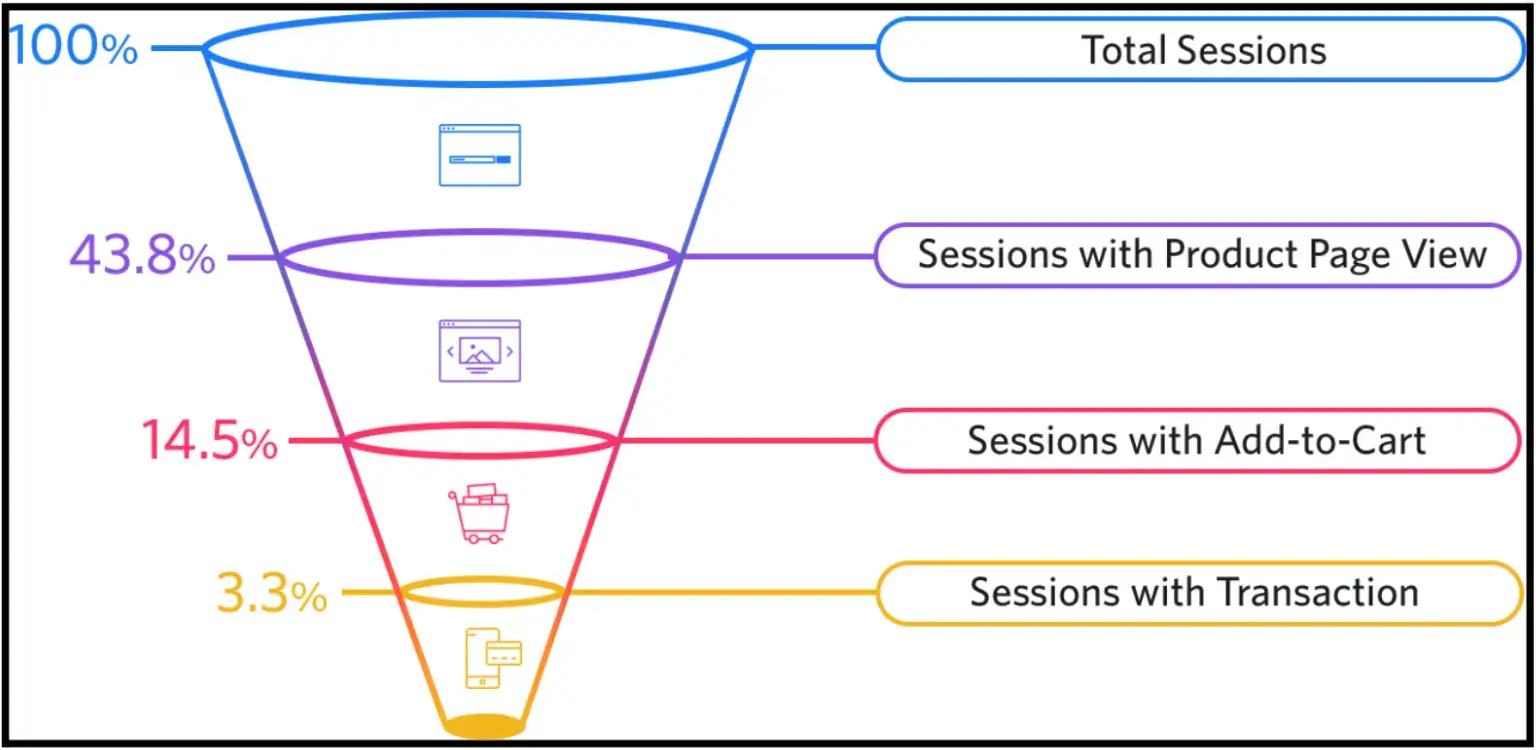
E-commerce & CRO Stats: Most Revenue Is Lost to Friction
Most conversion gains don’t come from big changes. They come from fixing obvious friction.
Source: Smart Insights
- Global e-commerce sales reached roughly $5.8 trillion in 2023. Scale isn’t the issue. Efficiency is. Shopify citing eMarketer
- Average cart abandonment rate: 69.99%. This is where most revenue is lost. Not at acquisition. Baymard Institute
- The average e-commerce site can increase conversion rates by 35% by improving checkout design. The upside is already inside most funnels. Baymard Institute
- The top reason for cart abandonment: extra costs (shipping, taxes, fees) are too high (48%). Baymard
- Account creation is required to place orders (24%). You’re adding a step before the decision is finished. That’s where a lot of drop-off happens. Baymard
- Delivery is too slow (22%). This is an expectation mismatch more than logistics. If timing isn’t clear early, people leave. Baymard
- Didn’t trust the site with a credit card (18%). Trust isn’t built at checkout. If it’s missing here, it was missing earlier. Baymard
- Checkout too long or complicated (17%). Each additional step gives people a reason to stop. Baymard
- Couldn’t see the total order cost upfront (17%). Surprises at the end feel like friction, even if the price hasn’t changed much. Baymard
- Website errors or crashes (13%). Technical issues break intent immediately. There’s no recovery from this in-session. Baymard
- Unsatisfactory returns policy (12%). People factor risk into the decision. If returns feel uncertain, they delay or abandon. Baymard
- Not enough payment methods (9%). If their preferred option isn’t there, many won’t switch. They’ll just leave. Baymard
- Credit card declined (4%). Lower frequency, but high finality. This usually ends the session. Baymard
- Product reviews can increase conversion rates by up to 270% for lower-priced items. Spiegel Research Center
- For higher-priced items, reviews can boost conversion by up to 380%. Spiegel Research Center
- 3D/AR product visualization can increase conversion rates by up to 94%. Shopify
- A 0.1s faster mobile site can lift retail conversions by 8.4%. Think with Google/Deloitte
- Popups convert at an average of 3.09%, with top performers exceeding 9%. Sumo
- Exit-intent messaging can recover abandoned visitors without interrupting engaged users. Convert.com
Conrad Wang, Managing Director of EnableU, works in disability support services where reliability and trust are central to every decision.
Mobile Marketing Stats: Speed and Simplicity Decide Everything
Mobile isn't the "second screen" anymore. It's the first stop for discovery and buying. Speed and simplicity decide who stays.
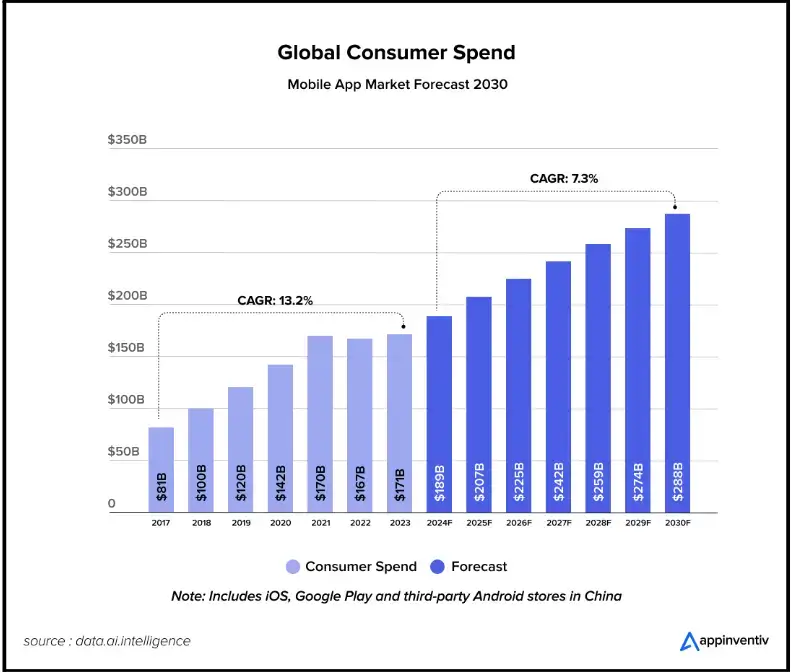
Source: appinventiv
- Mobile accounts for 59% of global web traffic. StatCounter
- 53% of mobile users abandon sites that take longer than 3 seconds to load. Think with Google
- From 0–5 seconds, each additional second of load time drops conversion rates by 4.42%. Small slowdowns add up to real revenue loss. Portent
- Consumers spent $171 billion in mobile apps in 2023. State of Mobile 2024
- Global app downloads reached 257 billion. Usage is deep, not occasional. data.ai
- In leading markets, people spend 5+ hours per day on mobile devices. data.ai
- Mobile speed improvements can deliver immediate conversion gains across industries. Think with Google/Deloitte
- Most e-commerce sessions now start on mobile, but desktop often still converts higher. Optimize for assisted conversions and save cart flows. Salesforce Shopping Index
- Apps with strong onboarding see much higher Day 1 and Day 7 retention than those without. Adjust Benchmarks
- Lightweight, silent push prompts outperform aggressive prompts for opt-in rates. OneSignal
Adrian Iorga, Founder & President of Stairhopper Movers, runs a moving company where most customers are booking under time pressure.
Advertising & Marketing Trends: Privacy, Automation, and Creative Shift
Source: HubSpot
The balance to strike: personalization that performs without creeping people out.
- US internet ad revenues reached $225 billion in 2023, up 7.3% year over year. IAB
- Programmatic buying accounts for roughly 90% of US digital display ad spend. Insider Intelligence
- Third-party cookies in Chrome are scheduled for deprecation, with timing moving into 2025 as Privacy Sandbox matures. Privacy Sandbox
- First-party data and consented audiences outperform as signal loss grows. IAB
- Personalization done well can lift revenues by 5–15% and improve marketing spend efficiency by 10–30%. McKinsey
- Interactive video ads drive 47% more time spent and stronger purchase intent in tests. MAGNA/IPG Media Lab
- CTV ad investment continues to climb as cord-cutting accelerates. IAB
- Retail media networks are attracting a growing share of digital ad budgets due to closed-loop measurement. IAB
- Creative relevance is the primary driver of ad effectiveness across channels. Nielsen
How to Turn These Marketing Stats Into Action (Not Just Insights)
Data doesn’t become useful until something starts slipping.
You’ll usually see it in the numbers before anything else. A channel that used to convert starts flattening out. Traffic holds, but outcomes don’t. A page gets visits, but people don’t move forward.
Identify Where Performance Is Breaking
Start with what’s clearly underperforming.
Look at channel-level ROI. Entry pages that don’t hold attention. Funnel steps where people drop off. Cohorts that don’t come back. You don’t need a full audit. Just enough to see where things are breaking.
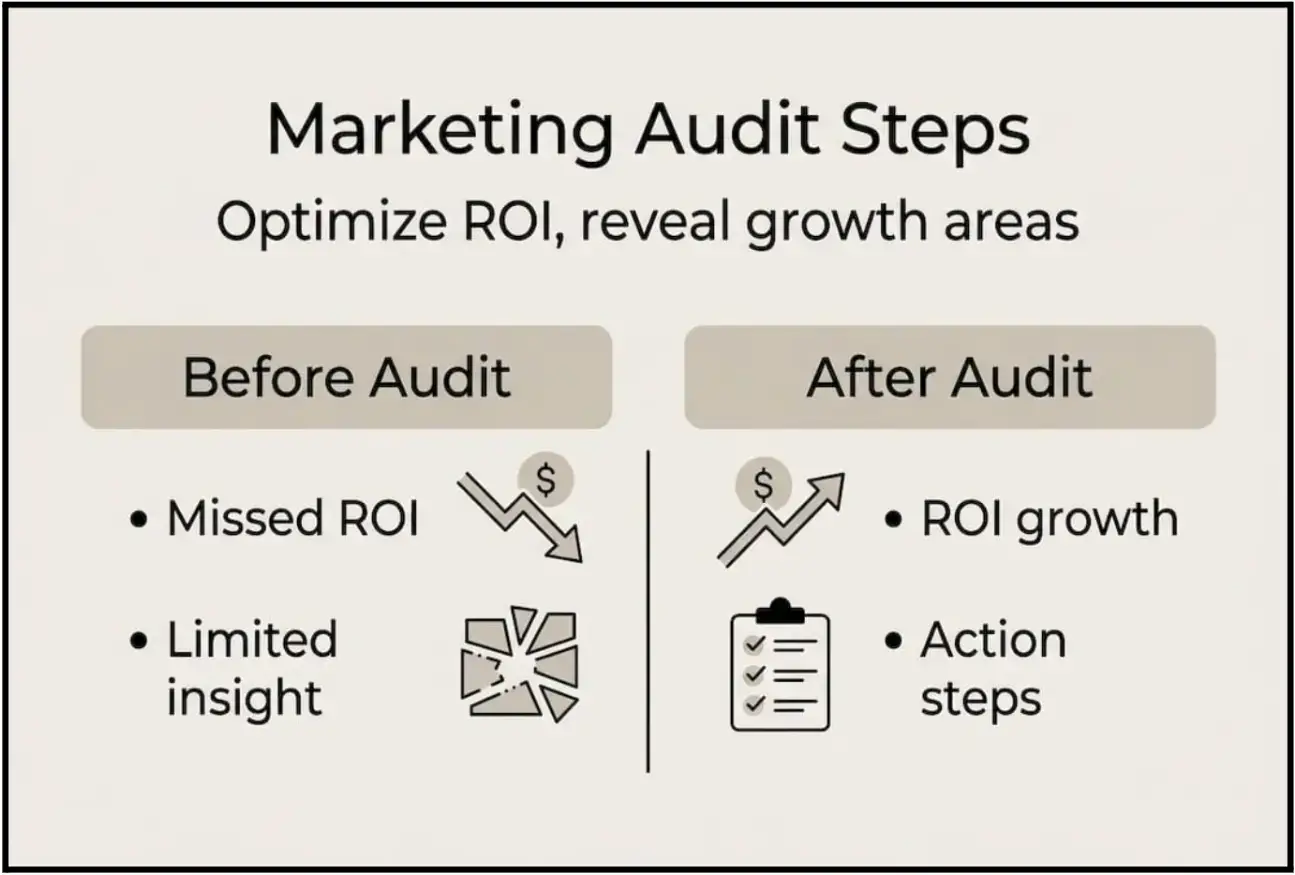
Source: AdVenture
Then connect a few of these stats to those gaps.
Build a Shared Performance Scorecard
The longer the cycle, the harder it is to know what actually worked.
Shorten it.
Weekly experiments give you direction. Monthly reviews help you decide what to keep. Anything slower than that usually turns into guesswork.
Emily Carter, Content Specialist at Searqle, focuses on how users interpret signals across fragmented journeys.
Shared scorecards help when data is scattered across teams, only if everyone is actually using the same ones.
Keep Your Stack Simple and Actionable
Most problems show up without needing a complex setup.
- Basic event tracking.
- Cohort views.
- A/B testing.
- Form analytics.
That’s usually enough to spot where people drop off or hesitate.
Keep it simple. Fix what’s visible.
Key Takeaways: The Patterns Behind the Data
Most of this isn’t new.
The patterns have been consistent for a while: speed matters, clarity matters, timing matters. What’s changed is how quickly performance drops when those aren’t in place.
If something isn’t converting the way it used to, the issue is usually not a lack of tools or channels. It’s friction somewhere in the experience, slow pages, unclear messaging, too many steps, or missing context when people are ready to act.
Start small. Look for where users hesitate, where they drop off, or where intent doesn’t carry through. Test simple changes, measure quickly, and build from there.
Tools can help speed up that process, especially when you want to experiment without heavy development work. But the biggest gains still come from understanding what’s getting in the way and fixing that first.
FAQs
1. Are marketing benchmarks like open rates and CTRs still reliable?
They’re useful for orientation, not judgment. Changes in tracking (especially email) and platform differences mean benchmarks don’t tell you much on their own. What matters is how your numbers move over time and where they break relative to your own baseline.
2. What has the biggest impact on conversion rates right now?
Removing friction. Not redesigns or new features. Clear pricing, fewer steps, faster pages, and predictable outcomes. Most gains come from fixing what’s already slowing people down.
3. Do email open rates still matter?
Less than before. Privacy changes have made them unreliable as a performance metric. They’re still useful for spotting issues, but clicks, replies, and downstream actions matter more.
4. Is mobile optimization still a priority or already solved?
Still a problem. Traffic is mobile-first, but conversion often isn’t. The gap usually comes from speed, layout friction, and incomplete flows that work on desktop but break on smaller screens.
5. How should marketers actually use these stats?
Not all at once. Pick a few that reflect what you’re already seeing, drop-offs, slow pages, weak engagement, and test against those. The value is in direction, not volume.