
You work hard to design engaging content and experiences for your customers. You tailor your marketing messages and branding to pull in your target audience.
Interactive infographics stand out from traditional visuals by actively engaging viewers, leading to higher retention and increased conversions.
Unlike static images, an interactive infographic involves the audience, encouraging them to click, explore, and interact, ultimately driving more effective communication of your message.
Static visuals no longer capture attention the way interactive formats do. Brands are increasingly turning to immersive content formats like infographics, quizzes, and even a digital flipbook to keep users engaged and encourage deeper interaction.
But are you still stuck on stationery visual content? Why not branch out into more interactive formats, such as interactive infographics?
In this guide, we’ll cover interactive infographics and how to start using them.
In this article:
- What are Interactive Infographics?
- Why Should You Use Interactive Infographics?
- How to Create an Interactive Infographic
What are Interactive Infographics?
Interactive infographics include dynamic elements to engage with readers. Their visual elements involve moving or changing content, often reliant on the reader’s input.
There’s a large range of interactive web design elements that can be included, such as clickable buttons, hover animations, and marketing quizzes.

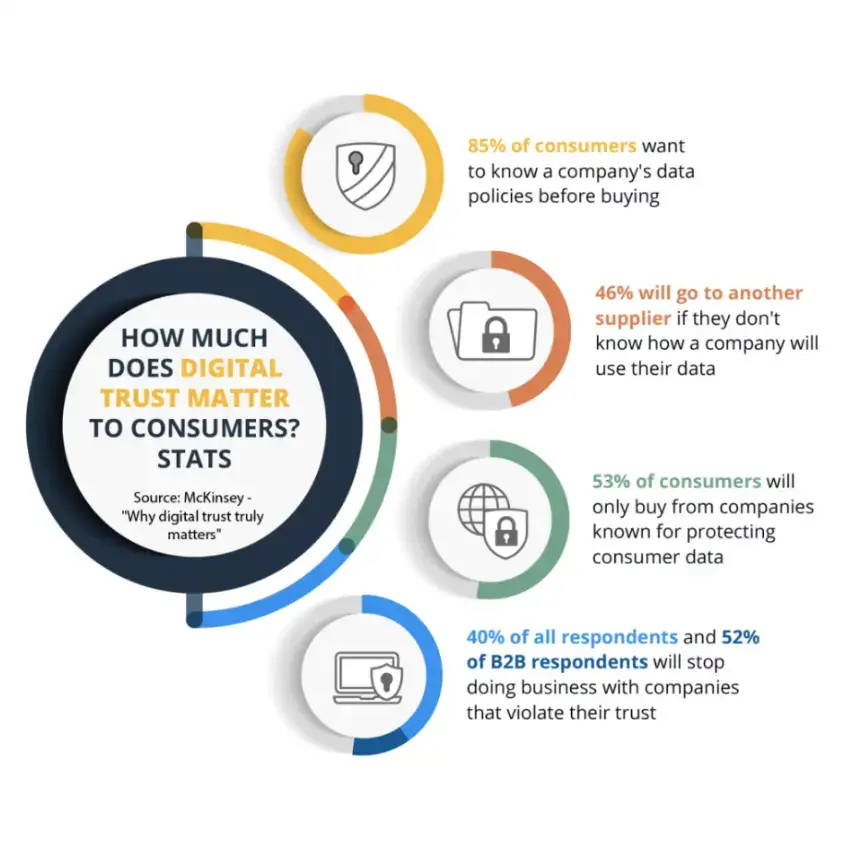
Scrolling down the page reveals imagery that supports the statistics, changing as you read on

Source: Source
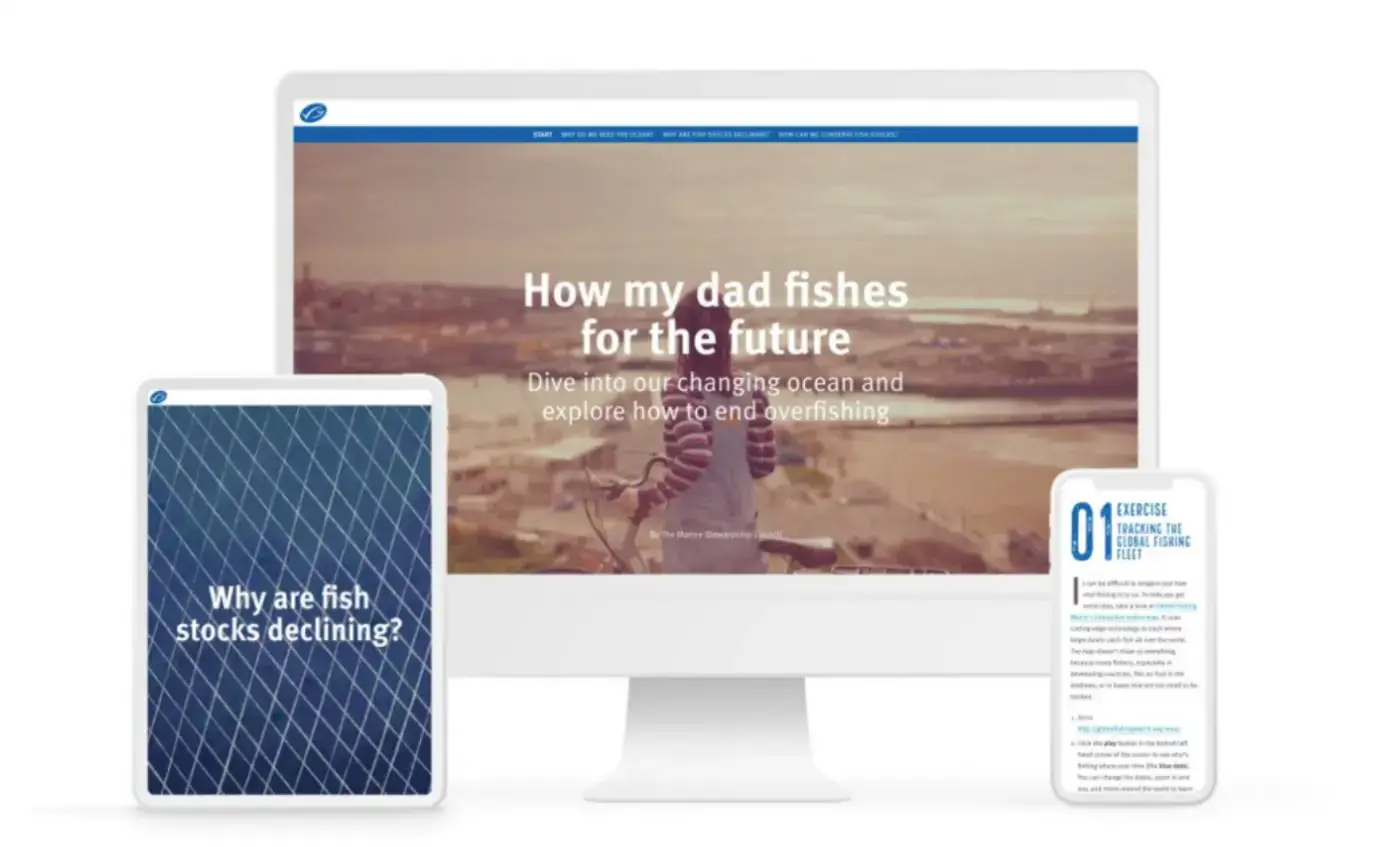
For example, let’s look at an infographic from the Marine Stewardship Council.
The title of the content is “How My Dad Fishes for the Future.” As the reader scrolls, they first read a story about a father and daughter.
After the emotional heartstrings are pulled, the hard-hitting facts are presented, supported by imagery that adapts to the section. There’s a link to a YouTube video for more visual learners.
As visitors dig deeper, they are visually educated on the consequences of overfishing. The infographic then calls on readers to learn more about this global crisis.
Why Should You Use Interactive Infographics?
As technology has evolved, visual media have become increasingly important for storytelling and SEO. The rise of the internet has made digital media a key channel for businesses selling products.
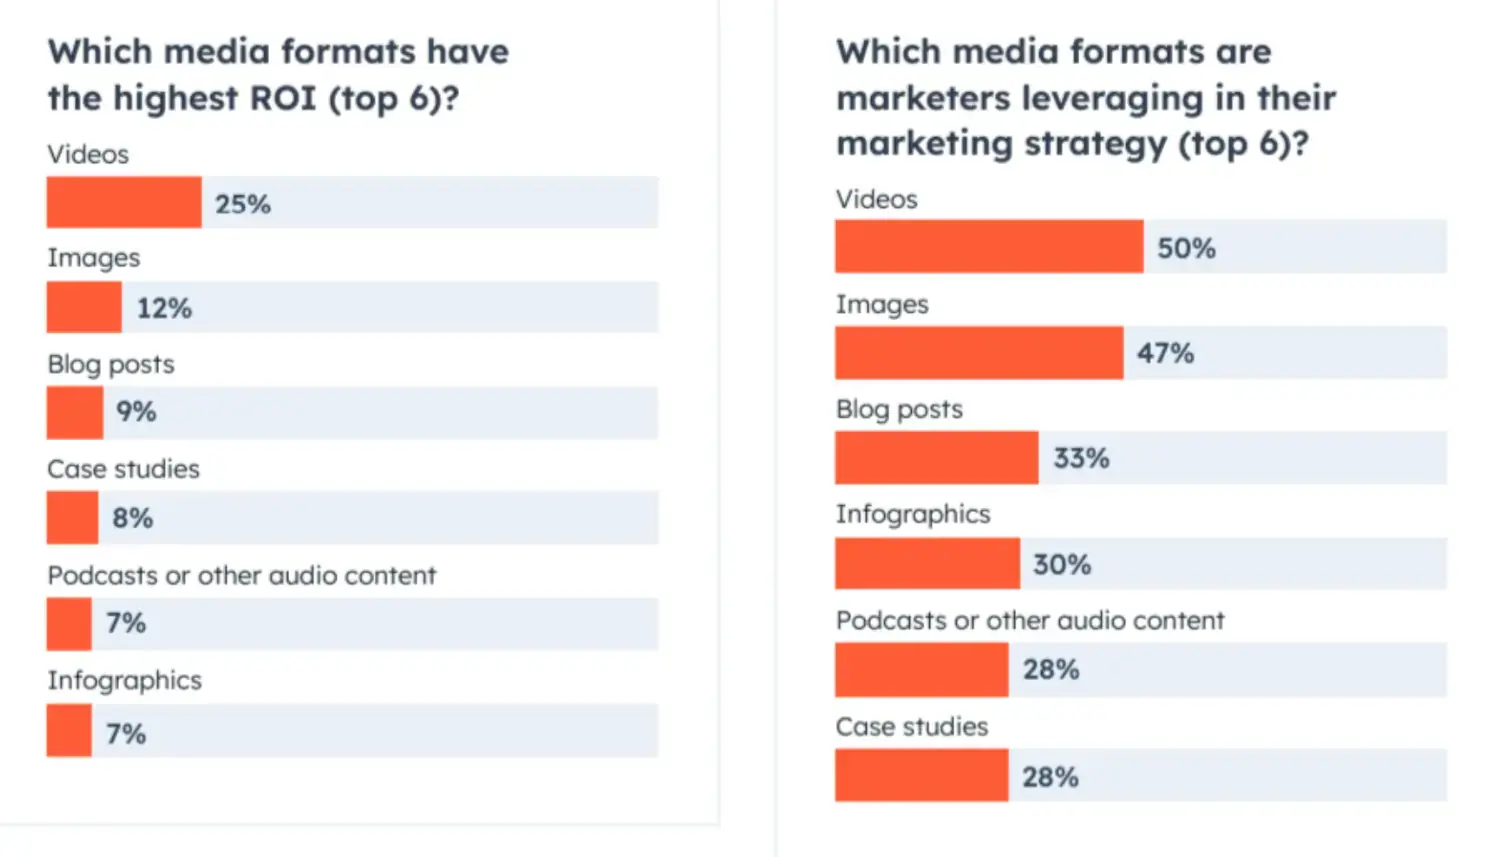
30% of marketers are leveraging infographics in their marketing strategy.
Source: Source
HubSpot surveyed 1,200 marketers about the different formats used in their marketing efforts.
Visual storytelling is clearly key to user engagement. But as well as having a high ROI, there are many other benefits to infographics - especially when they’re interactive:
Better engagement
Interactive content gives your prospects something extra.
It doesn’t require them to simply read or view the content. It asks them to participate in the experience. It may be clicking, scrolling, or simply hovering over an infographic.
This level of interactivity increases engagement - with data from Mediafly finding interactive content 52.6% more engaging than static content.
Generate more leads
Interactive content enables your marketing team to gain deeper insights into your prospects.
Dynamic infographics can include online quizzes, surveys, forms, and games. These gamified interactions give you a deeper understanding of website visitors.
Infographics can also be converted to an online flipbook format, preserving their interactive features while adding the visual appeal of a page-turn effect.
Demographics and other visitor information can be gathered through your infographics. For example, let’s say you sell Windows remote desktop solutions.
A simple infographic with a quiz can determine the size of the customer’s business and the number of employees. Then, they can see information tailored to them, while you have some brand-new intel to help you improve your marketing. It’s a win for everyone.
Increase conversions
Another consideration is that “interaction” requires action.
Your audience is already taking action during the content experience. They are primed to meet the next call to action and click the buy now or subscribe button.
Rock Content found that interactive elements helped boost conversion by 20.7%, while an interactive infographic with a calculator generated an 82% increase in revenue for FedEx.
Promote viral sharing
When it comes to social media or even email, what makes someone share digital content? Typically, viral content is:
- Engaging
- Concise
- Visually appealing
- Entertaining
- Informative
- Emotive
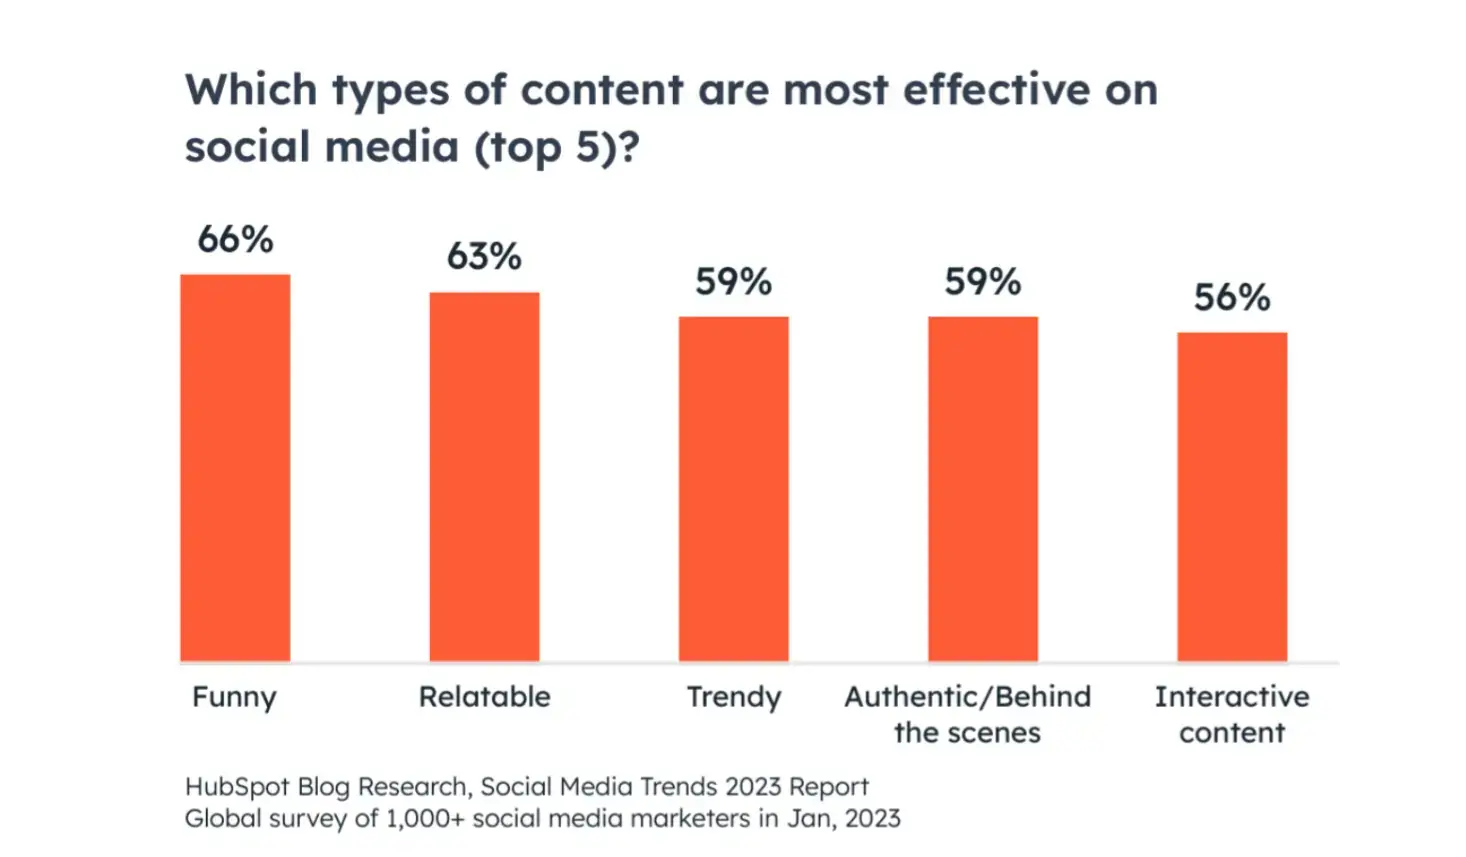
Content like interactive infographics is among the top five content types on social media.
Source: Source
Dynamic infographics can fit viral elements into a streamlined experience. Granted, some infographics are quite long. However, users can experience others in minutes or less—perfect for sharing on social media!
An interactive infographic should integrate social sharing, making it easy for users to share content with just a few clicks.
Improve website SEO
Best practices such as selecting the right keyword or using a .ae domain for doing business in the United Arab Emirates are obvious. However, some aspects of search engine optimization can be more complex.
Give your audience something interesting to engage with, and they’ll spend more time on your site. This increases your page dwell time and helps reduce your bounce rate.
Those are two metrics that can help show Google that users want to spend time on your site.
How to Create an Interactive Infographic
- Define your audience
- Curate your message
- Choose your weapon
- Design interactive content
- Publish, test, and optimize

Creating an interactive infographic doesn’t need to be difficult. You don’t need to be a web developer or designer either. Just use the right tools and follow these steps.
1. Define your audience
The first step for any marketing strategy is to understand your audience.
Who are the people your brand appeals to? Where do they spend their time online? What pain points do your products or services alleviate for these segments?
Identify your target audience and buyer personas. Define demographics and user behavior for your ideal buyers. This information will form the foundation of your success.
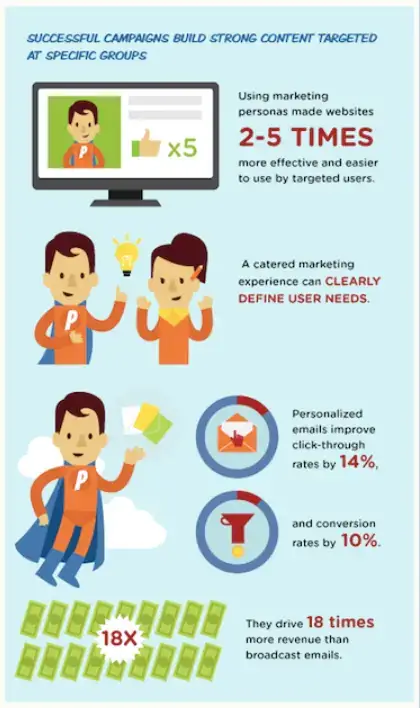
Defining your audience and personalizing your infographics according can greatly improve their success.
Source: Source
2. Curate your message
Next, you need to tailor your message to the moment.
You know you want to educate and entertain your audience but remember, every piece of content should have an ultimate goal or purpose.
What are you trying to get across to potential customers? Do you want to spread brand awareness? Or are you focused on increasing engagement, lead generation, and conversions?
For example, let’s say you provide remote support software.
Do you want prospects to understand how the product is important for their business?
In which case it’s best to use infographics to clearly prove how useful it can be and how it aligns with business goals. Generally, it’s best to focus on just one idea so as not to overwhelm them with information.
RealVNC use an infographic to highlight how important data security is to businesses to demonstrate how valuable their secure remote software is.
Source: Source
3. Choose your weapon
Okay, so you have a message and an audience. Now, it’s time to pick your infographic format. You have plenty of options to choose from, including:
- Map-based infographics. Dynamic content appears when users either click or hover over map areas.
- Flowchart or scrolling infographics. Graphics appear and change as users scroll through content.
- Timelines. Data appears over time as users progress through content.
- Charts and graphs. This is a classic visual representation of data but includes clickable elements and interactive charts, going beyond the usual static infographics.
- Quizzes. Users take a quiz and then are provided with the results.
- Gamified infographics. Users interact with challenges, flash games, and quizzes.
- Carousel infographics. Users are presented with information in a presentation of slides. This works very well for touch screens on mobile devices.
- Clickable infographics. Readers click on different areas to access information.
Which infographic type you choose depends on your audience and how to best engage them. It will also depend on the topic or goal of your message.
For example, surveys and quizzes are good at generating leads. However, a flowchart or carousel will be better at educating users on the unique selling proposition (USP) of a small business phone service.
4. Design interactive content
Now, it’s the fun part. You need to design the interactive content. Don’t worry if you’re not a web developer - there are many tools available to help you generate interactive content.
Creating an interactive infographic can be made simple using platforms like Canva, which offer templates to get you started quickly.
- Hire a developer. This requires the least amount of work on your part, but it may be expensive. The good news is that you will enjoy having a unique and dynamic infographic that is truly memorable.
- Use a design application. Tools like Canva can streamline infographic design. They let you design infographics without coding knowledge. However, adding interactive elements requires some digital skills and knowledge.
- Use an interactive content platform. Services like Tiled and Shorthand provide design templates. You can also reuse infographics and edit areas like headers, footers, and buttons.
Whichever route you use, keep the user experience (UX) in mind for both desktop and mobile users. Consider the ratios and size of the interactive elements to maintain consistency for every visitor.
Example from shorthand of an interactive story infographic that was developed for desktop, mobile and tablet experiences
Source: Source
5. Publish, test, and optimize
Now it’s time to publish that infographic! Test the waters by posting content on your website, marketing emails, and social media channels. Use tools like Google Analytics to track vital KPIs such as:
- Click-rates
- Page views
- Dwell time or session duration
- Conversion rates
- Likes, shares, and comments
- Organic traffic and traffic sources
- Unique users
- New leads generated
- Bounce rate
Track the most relevant KPIs for your goals. If you want to create viral brand awareness, focus on likes, shares, and comments, as well as page views and unique users.
Don’t forget to implement A/B testing of interactive elements. Test out things like placement, color, font, size, and other variables.
Encourage Interaction and Gain Conversions
Interactive infographics help you relate to your audience with digital storytelling and compelling content. They boost audience engagement, generate leads, and gain more conversions.
You don’t have to be a design expert to get started with dynamic visual experience. All you need is a willingness to learn and the right tools.
Add elements of interactivity like clickable buttons, animated charts, quizzes, and more to your infographics and reap the benefits.
FAQ
1. What is an interactive infographic?
An interactive infographic is a visual representation that includes dynamic elements, such as clickable buttons or animations, which engage users actively rather than passively.
2. Why are interactive infographics important for marketing?
Interactive infographics enhance user engagement by involving the audience in the content, leading to better information retention, higher dwell times, and improved conversion rates.
3. How do I create an interactive infographic without design skills?
You can use tools like Canva, Visme, or Piktochart, which offer templates and easy-to-use features for creating interactive infographics without requiring design skills.
4. What types of interactive elements can I include in my infographic?
You can add clickable buttons, hover effects, quizzes, animations, and scrolling effects to make the infographic more engaging and informative.
5. How do interactive infographics improve website SEO?
By keeping users engaged longer, interactive infographics help reduce bounce rates and increase dwell times, both of which are important SEO metrics that can improve your website’s ranking.
6. Can interactive infographics help generate more leads?
Yes, interactive infographics can include forms, surveys, or quizzes that gather user information, making them effective tools for lead generation.