
Data visualization is the creation of visual representations of complex data and information. It involves the use of status, dynamic, and interactive elements.
Because of the abundance of data, data visualization tools have become indispensable. Data visualization converts raw data into graphical insights.
With data visualization, an organization will be in a better position to make sense of available data and use it to meet business objectives.
Skip to:
- Why is Data Visualization Important?
- Why Choosing the Right Visualization Tool Matters
- Factors to Consider While Choosing a Data Visualization Tool
Data visualization helped Nissan reduce warranty claims and save millions of dollars. The company now uses data visualization to improve its product offerings and recalibrate business processes.
Visualization of data can help companies design and run better marketing campaigns.
According to Hubspot’s 2023 Marketing Strategy and Trends Report, data-driven marketing strategies have risen in popularity and importance. Data-driven marketers are all set to win this year.
Data-driven strategies help businesses identify high-quality leads and eventually boost lead conversions. Data visualization can help companies develop effective data-driven strategies.
Read more about digital marketing strategies.
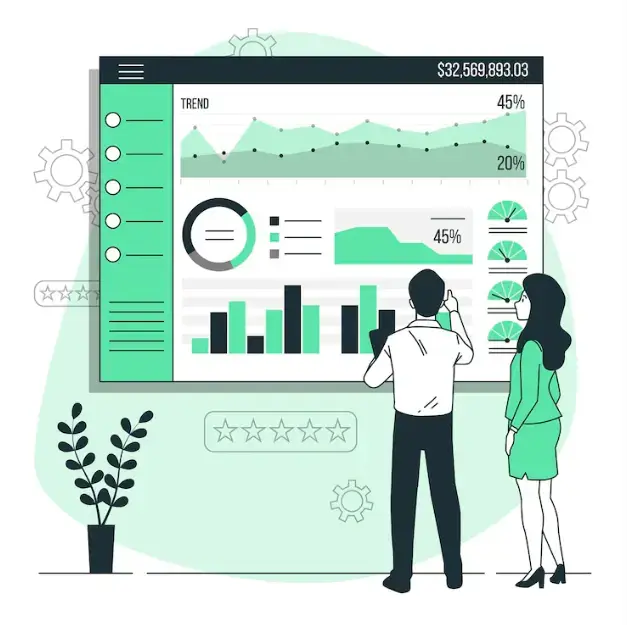
Source: Freepik
Why is Data Visualization Important?
Data visualization makes it easier to communicate and comprehend complex data relationships.
It enhances data analysis; it helps to extract valuable insights from large amounts of data. It can help leverage vast amounts of available data.
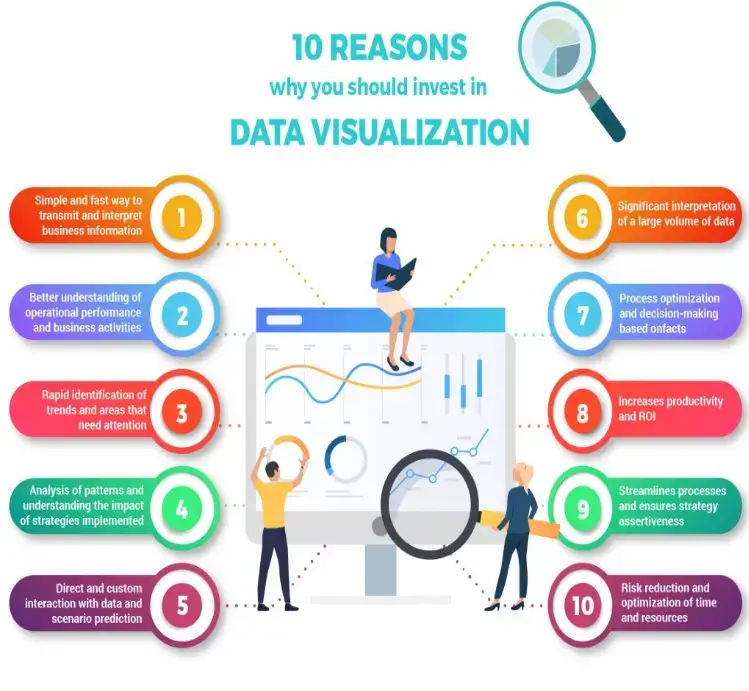
Additionally, data visualization can help quickly identify data errors. By concisely providing timely information, data visualization leads to more accurate and effective decisions.
On-demand data visualization can increase productivity and the efficiency of operations. It increases the speed of decision-making, which in turn, increases the competitive edge of the business.
Data visualization can help predict trends better and put the business in a better position to make the most of upcoming opportunities.
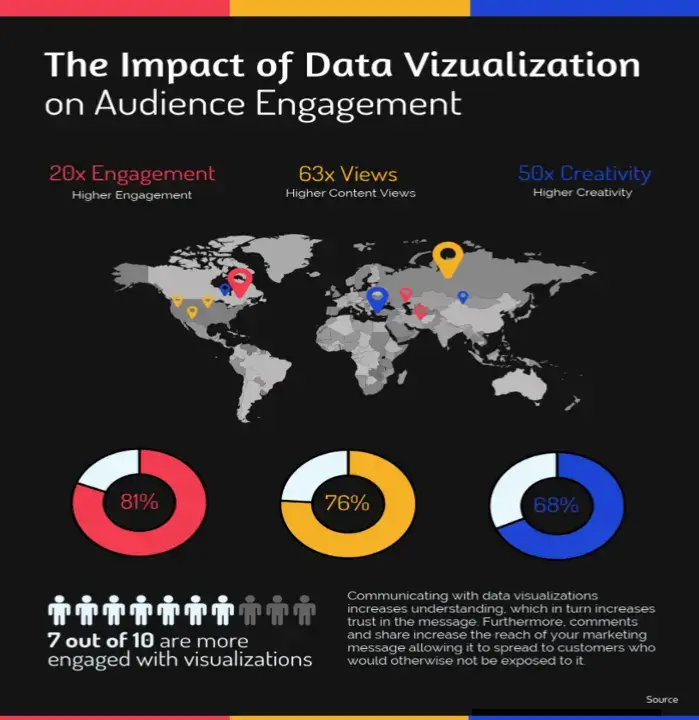
Source: Venngage
Data visualization can help enhance the impact of the messages on the target audience.
Visualization holds considerable engaging and persuasive power. It will save time and labor costs by automating processes. It will also reduce errors that arise due to manual reporting.
Source: SR Analytics
Why Choosing the Right Visualization Tool Matters
Selecting the right visualization tool can help your business avail the benefits that data visualization has to offer.
It will be easier for the stakeholders of your business to grasp valuable insights when the information is presented in a visually appealing and easy-to-understand manner.
All users will be able to explore the data more deeply.

Source: Freepik
A tool that is not suitable for the kind of data your business handles can lead to incorrect representations of data.
This can set in motion a chain reaction, wherein, the inaccurate representation might lead to wrong messages and misinformed decisions with negative consequences.
Some tools are more suitable for beginners, while others are best used by professional analysts and experts.
Certain visualization tools (such as Grafana or hosted OpenSearch) cater better to the needs of large organizations, while others are suitable for small and medium organizations.
Choose the right visualization tool for your business to maximize the value of your data. A suitable tool can help your business stay on top of the game.
It can significantly affect the efficiency and success of your business in this data-driven world. Increase the potential of your data with the tricks from the latest and best AI certifications.
Factors to Consider While Choosing a Data Visualization Tool
Before you invest in a data visualization tool, carefully consider these factors:
-
Data complexity, volume, and format
The data visualization tool should have the capacity to handle the volume and complexity of your business data. The tool should also be able to handle the format of your data.
If it is not compatible with your data, you will lose the investment you made in the tool. The worst-case scenario would be other losses due to decisions based on inaccurate visualizations of data.
The visualization tool should also offer data analysis options and insights along with the most suitable type of visualization for your data.
Additionally, it should also allow you to export the visuals in various formats (such as pdf or jpeg). Especially in the case of complex visualizations, check the speed and responsiveness of the tool.

Image Source: Freepik
-
Ease of use and learning curve
The learning curve is an important factor to consider. Opt for a user-friendly visualization tool. Evaluate its ease of use against the current skill levels of your team.
-
Customization and interactivity
Ensure that the tool offers customization options. You should be able to change colors, labels, and other visual elements according to your preferences and requirements.
The tool should get additional brownie points if it has interactive features like tooltips and filtering.
-
Collaboration and integration
Your business requirements might necessitate that the tool be used by multiple users.
The visualization tool should support collaboration features. It would be best if the tool is easy to integrate with the other tools and platforms used by your organization. It should possess the ability to connect to your data sources (including live data connections).
An embedded BI tool can seamlessly integrate data visualization capabilities into your existing business applications, providing users with immediate access to insights without switching platforms.
You may also require mobile compatibility, and if so, confirm if the tool can work well on mobile devices.
-
Cost and scalability
The tool you choose should not run into performance issues if and when it is required to handle larger datasets.
Testing and trials can help you make sure. Between the available visualization tool options, you will need to compare pricing plans. Check for hidden costs such as additional costs for other features or more users.
There may be costs associated with vendor updates and maintenance as well. Consider the future and long-term needs of your organization.
There are quite a few popular data visualization tools such as Power BI and Tableau from which you can select the one that best suits your needs. Some tools offer you the option of integration with other useful software.
For instance, you can use Power BI on data from Business Central. Although at first glance, most tools might seem like they have similar features and capabilities, the tools differ in the preferences and requirements to which they cater.
Read more about AI marketing tools for 2024.
You can make use of the abundant online resources to learn how to operate data visualization tools. Opting for a good Power BI course online can help you get thorough with the basics.
Through such quick online courses, you can learn better ways to manage your data, create visualizations, and share reports in minimal time.
Wrapping Up
Being extra cautious at the visualization tool selection stage will help avoid issues later.
To choose the right tool, you should first define your objectives and purpose. Conduct an assessment of your data and the requirements of your audience.
Then, prepare a set of criteria. Evaluate the available tools and make a shortlist. Take time to consider your budget and resources.
Finalize a tool that strikes a good balance between your criteria and budget. Start using the visualization tool and soon it will be time to reap ROI.
A great data visualization tool can be a business intelligence asset to your company.