
What people like and dislike about brands and their products is constantly changing. Consumer preferences for this upcoming holiday season are difficult to predict.
Physical stores have an advantage over those in ecommerce here; they can observe customer behavior. They can also interact with shoppers to gather feedback and clarify questions.
What can online stores do to gather this kind of data? Sure, you can collect data on website visits or even tally up the source of traffic. However, basic site analytics will only get you so far.
Wouldn’t it be nice if you could read the minds of your potential customers? You can’t do that, but you can gain behavioral insights into the minds of users who visit your website or shop on your mobile app.
In this article:
- Some Examples of Behavioral Data Analysis Tools
- The Benefits of Tracking User Behavior
- How to Use Behavioral Data to Raise Conversions
- Discover user intent
- Track the right data
- Find out why people leave
- Identify what converts
- Optimize your funnel
What is Behavioral Data?
Behavioral data is the why and how users interact with your website, mobile app, and other digital environments. It encompasses the entire user interaction, from beginning to end.
The Three Types of Behavioral Data
So, where does all this information come from? There are three main ways behavioral data makes it to your business:
- First-party data is data you collect from websites, apps, and social media accounts.
- Second-party data is data collected by another company that you can access.
- Third-party data is user data sold by companies that you can purchase.
Today, we are focusing on first-party behavioral data. The information helps define the user experience with your website and mobile application when shopping.
User Behavior Analytics
User behavior analysis (UBA) interprets consumer data during interactions with your digital spaces. Various tools, such as session recorders, help you observe customers and glean insights.
For instance, data could show a user scrolling down a homepage and then back to the top to click on your “Shop” page. Next, they search for the product search bar, give up, and hit the Back button on their web browser.
Without this additional context, you would only see a user visiting your website, clicking on a single page, then bouncing.
Some Examples of Behavioral Data Analysis Tools
Businesses can implement UBA using the following analytical tools.
Heat maps
Heat maps are visualizations of where users interact with your websites and apps. Maps can show you where users scroll, where they hover, and where they click on each page.
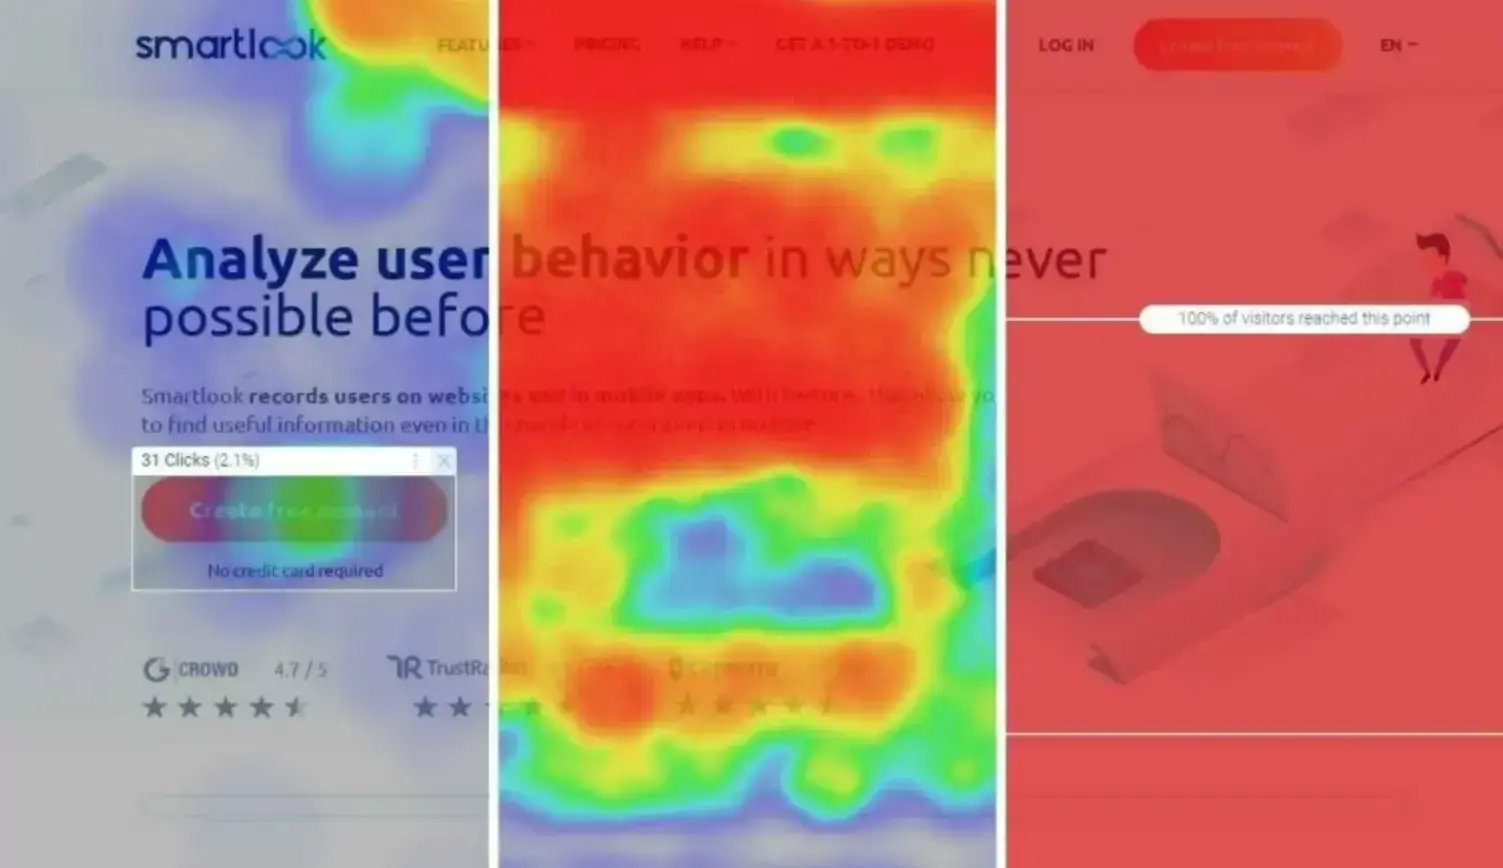
Source: smartlook
Platforms like Hotjar and Crazy Egg collect this information and present it in easy-to-read images. Typically, the hot areas where users interact most are highlighted in red. The cold areas, mostly ignored, are blue.
There are also scroll maps, click maps, and attention maps that operate similarly.
Session recordings
Session replays or recordings are observable playbacks of individual usual interactions.
Recordings help you better understand what people are trying to do and gain user empathy. Observing potential customers' sessions can highlight areas of frustration and help you improve the UX.
Feedback surveys
One of the easiest ways to understand why users do something is to ask them. Feedback forms can be tailored to specific interactions or sent out post-purchase.
Behavioral data can be gleaned from online surveys, including:
- Email surveys
- Customer satisfaction (CSAT) forms
- Pop surveys during interactions
- Net Promoter Scores (NPS)
- Customer service questionnaires
- Onboarding surveys
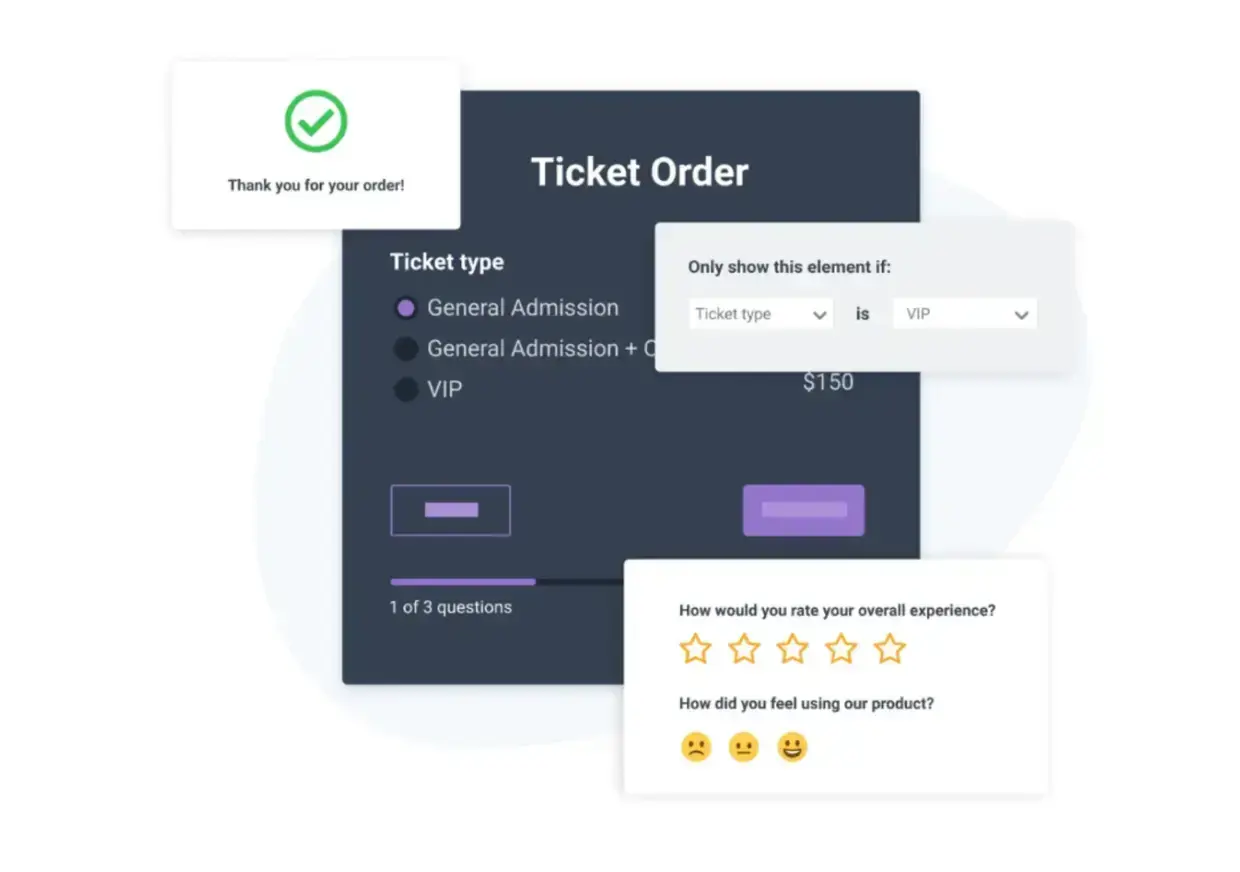
Source: POWR
Website app builders like POWR make it easy for you to implement feedback surveys.
Website analytics
Much of the quantitative behavioral data can be collected from Google Analytics. Tracking behavior, such as website visits and bounce rates, is the first step in determining where to focus your efforts.
Page Insights can add context to metrics by assessing each web page's performance on mobile and desktop devices. Alternatively, sales intelligence tools can be used to gain behavioral insight from website, email, and social media interactions.
Path reports
The customer journey is no longer linear. Users have many ways to reach conversion.
They can reach stores through various channels, such as SEO or social media. At the same time, they expect an omnichannel experience. They want to switch channels seamlessly while shopping.
Path analysis tools generate a diagram of the pathways and branches a user can take when using your app or website. They help you better understand the various user journeys.
Funnel analysis
Funnel analytics are somewhat similar to path analytics. The difference is that funnel analysis focuses on a linear journey. For example, a classic funnel would be the user:
- Arrives at your website
- Browses the product catalog
- Adds time to the shopping cart
- Enters checkout process
- Completes the checkout process
Funnel analysis focuses on the user behavior at each step of this linear path. The goal is to identify what is driving or hindering conversion at each stage.
The Benefits of Tracking User Behavior
Your business and its prospective customers generate vast amounts of data every day. Collecting and managing such a wealth of behavioral data is not straightforward.
What are the benefits of taking a UBA approach?
- To better understand users, answer the “why” questions regarding user behavior. You gain greater empathy, appealing to 87% of consumers looking for brands to understand them.
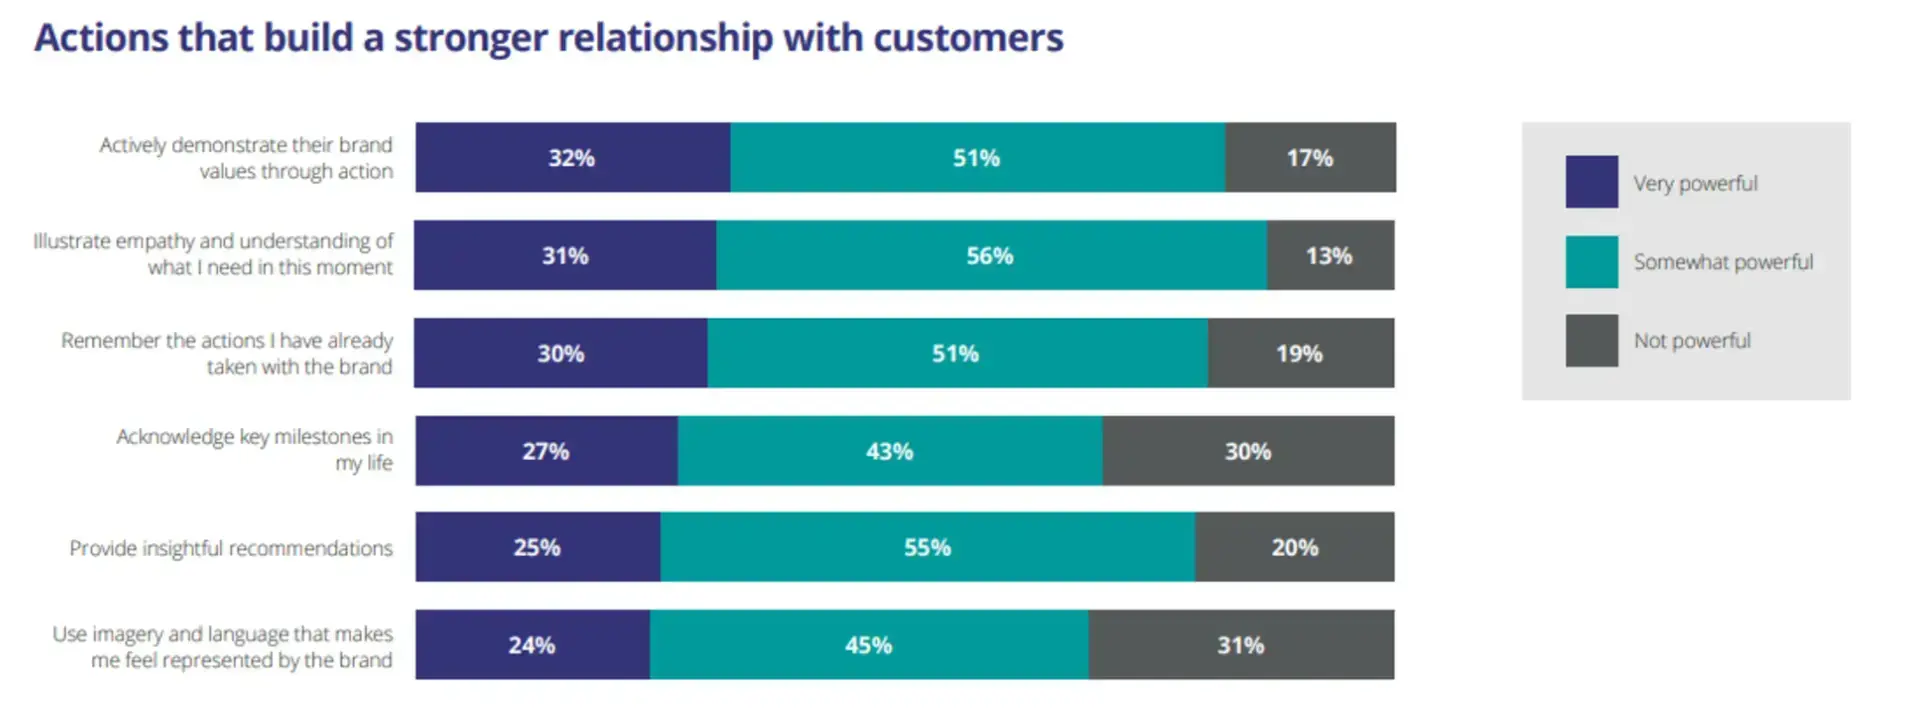
Source: retail-systems.com
- Increase conversion rates and engagement: Learn why users exit the website or abandon shopping carts. Use the information to improve touchpoints, create more engaging experiences, and boost sales.
- Identify Obstacles: Discover points of user frustration. Reduce friction in the customer journey.
- Develop buyer personas: Behavioral data helps you build more defined customer segments. Build detailed buyer personas to deliver tailored, personalized experiences.
- Strengthen customer loyalty: Your customers are happy when they think you understand them. Behavioral insights help you empathize and improve experiences.
- Optimize performance: Discover which app and website elements are critical to potential customers. Prioritize the paths and touchpoints that create happy customer pathways.
- Better decision-making: More data means you are more informed about marketing and sales decisions. Rise above the competition by prioritizing what your customers want.
How to Use Behavioral Data to Raise Conversions
Collecting behavioral data on your users is just one part of the process.
Analyzing this data is a separate task. What’s the endgame for behavioral data analysis? Raising conversions on your website and mobile applications.
Get a leg up for the busy holiday season by following these steps.
1. Discover user intent
The first step is to understand why users interact with you digitally. What is their purpose or goal for arriving at your website or opening up that smartphone app?
In general, users can be broken down into one of several categories:
- Just browsing: They don’t have any intent to buy but want to look around. They may be in the very early stages of researching and comparing products and brands. Browsers are the most difficult to convert.
- Returning visitors: Somewhat interested users. They’ve checked out your store before and are familiar with your products. These users are undecided about next steps. Returning users need a nudge to click the Buy Now button.
- Determined buyers: Users visiting your store with the intent to buy. They may be existing customers or new converter buyers. You want to provide these users with a streamlined journey to accomplish their goals without any issues.
Of course, these three user types are generalizations. After further data analysis, you might be able to break users down into more specific categories.
For example, you could target users wanting to buy at the right price or those checking for new stock.
Website analytics and visitor tracking tools help you distinguish new visitors from returning visitors. Other metrics, such as page views, indicate users with purchase intent. Shopping cart data and account creation indicate more determined users.
2. Track the right data
With so much information at your fingertips, what should you track? You want data to better explain what users are doing and why. Track user behavior metrics such as:
- Click-through rates (CTRs): clicking on pages, CTA buttons, links, and other elements.
- Dwell time: total time a user spends on a site or mobile app.
- Time on page: how long a user spends interacting with the page before leaving.
- Scroll depth: how far users scroll down a page.
- Bounce rate: the percentage of users who exit a page without taking any action.
- Cart abandonment: the rate at which users initiate but exit the buying process.
- Form abandonment: the rate at which users fail to complete forms.
- Conversion rate: the percentage of users who take desired actions, including purchasing.
There are only a few behavioral data KPIs you should monitor. For example, website performance metrics, such as First Contentful Paint (FCP), can help explain user behavior, including bounce rate.
3. Find out why people leave
Now you understand user intent and have the right datasets. It’s time to find out why people are leaving. Buyers who complete the checkout process are leaving because it’s “mission accomplished.” What about the other users?
The global shopping cart abandonment rate is over 70%. Customers exit the process for various reasons. Your only hope to prevent abandonment is to understand why people are leaving.
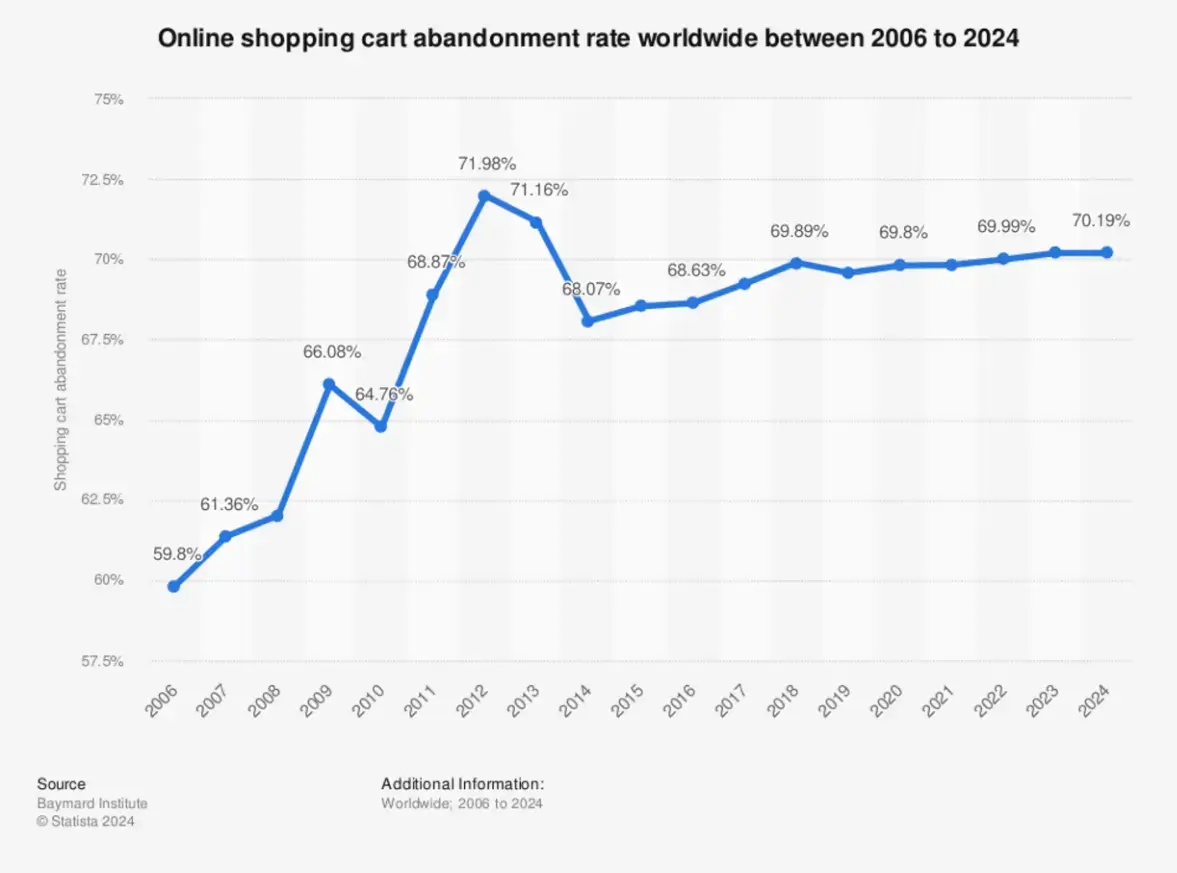
Source: Statista
Identifying exit intent relies on several behavioral data tools.
Heatmap software lets you see where users are interacting on each page. You can split the data by leavers and identify trends. Are many users leaving at the same point?
Filter exists based on dwell time, clicks, pages, and other variables to target specific behaviors. Are some pages generating a high volume of exits? If so, what’s going on there?
Heatmaps will highlight some general problem areas. Session recordings can bring deeper insights. Watch as many user replays as you need to identify why people are leaving.
Try using other channels for information, such as exit-intent surveys and online polls. Identifying obstacles such as poor CTA placement or lengthy payment forms helps explain why people leave.
Behavioral data can also help improve campaigns, such as Facebook retargeting ads. You address what drove someone away and aim to bring them back with a better experience.
4. Identify what converts
User behavior isn’t only about finding out what doesn’t work.
Knowing your strengths helps you reinforce and emphasize what you do best. Behavioral data highlights your best-selling points and informs future marketing tactics.
Conversion behavior also indicates what is most compelling to users, such as a flash sale or a key landing page. Again, analyze user behavior using tools such as heat maps, session replays, and website analytics.
Use post-purchase surveys to ask questions like “What convinced you to buy today?” and “How would you rate your purchasing experience on a scale from 1-10?”
You can request customer feedback immediately after a purchase or within a few days or weeks.
Both options have their benefits. It’s best to get answers when the customer’s mind is fresh. However, some time to cool off can give you more authentic feedback.
5. Optimize your funnel
Once you better understand user behavior, you can improve and optimize your funnel.
Work with your marketing and UX teams to emphasize what makes users happy. Focus on pathways with the highest preference. Eliminate bottlenecks caused by poor design or poor website performance.
Create accurate personas based on the behavioral data from your converting customers. Segment users and build separate funnels based on their goals and intent. You can use behavioral data to improve outreach.
Make minor, data-driven tweaks to your most successful paths. For example, you learn that customers who convert prefer product recommendations at checkout, so you add a simple widget.
Source: POWR
For high-exit pathways, A/B test link placement, button design, page layout, images, and other elements.
As always, continually monitor and read the data. Track success metrics like conversion rate and CSAT.
Keep changes that work and adjust those that don’t. Keep optimizing your website and mobile app to align with the behavioral data.
Don’t Only Collect Behavioral Data Seasonally
The competition peaks during the holiday season. It’s the perfect time to kick your behavioral data strategy into gear. The good news is that progress doesn’t have to stop in the new year.
Establish a system for gathering and analyzing user behavior and be rewarded year-round. Follow the basic steps in this guide and use the right tools.
In no time, you’ll have greater empathy for every user and convert more of them into paying customers.
FAQs
1. Why is behavioral data important?
Behavioral data is important because it provides insight into your customers’ preferences. You not only learn how they interact with your company online, but also why they do so. Knowing this allows you to tailor the digital customer experience to increase loyalty and conversions.
2. What is an example of behavioral data?
Examples of behavioral data include email or newsletter sign-ups, website page views, social media engagement, app downloads, cart metrics, shopping history, and video views.
3. How do you collect behavioral data?
The way you collect behavioral data depends on whether you want to track customers’ interactions with your emails, app, website, or social media.
To collect behavioral data from your website or app, use analytics tools such as Google Analytics and heat maps to analyze user actions.
You can also install pixels and create events to track behavior and analyze people’s page views and preferences.
To collect data on social media platforms or email, use the built-in analytics tools to track actions such as shares and comments, or email opens and click rates.