
Let’s cut to the chase: data is your most powerful asset in today’s relentless business environment. But it’s not enough to collect it — you need the tools to extract meaning from the noise and transform it into an actionable strategy.
That’s what data analytics and business intelligence (BI) are for. Statistics show that those who master their data master their market.
Article Shortcuts:
- What is Business Intelligence (BI)?
- How BI and Data Analytics Work Together
- Data Analytics and BI in Action: Case Studies
- Popular Data Analytics and BI Tools
- Guide to Getting Started with Data Analytics and BI
Consider this post your no-nonsense guide to making that happen for your business.
What is Data Analytics?
Data analytics is the science (and the art) of examining raw data to find hidden patterns, trends, and correlations.
It’s about finding the answers to complex business questions buried within the daily mountains of information your company generates.
Data analytics draws from computer science and statistical analysis (and more recently from artificial intelligence) to study and understand business operations in the past and present, and it uses that understanding to predict future trends to guide business decisions.
Understanding How Data Analytics Works
Think of data analytics as a journey, not a destination. Here’s the essential roadmap:
- Data gathering
- Data aggregation, cleanup, and management
- Descriptive, predictive, and prescriptive data analysis
- Presenting data and results
1. Data gathering
The adventure begins with collecting data from all relevant sources–sales figures, customer behavior, website traffic, internal operations, external sources like market research, and even your lead magnet. The key is casting a wide net.
2. Data aggregation, cleanup, and management
Raw data is messy. Before performing the first diagnostic analytics, you must clean it up, remove errors, standardize formats, and consolidate data into a central repository, like a data warehouse.
3. Descriptive, predictive, and prescriptive data analysis
This is where the magic happens. There are three main ways to analyze the clean, aggregated data:
- Descriptive analytics: This method uses descriptive statistics and visualizations to answer the question, “What has happened?” It examines the past to create reports and dashboards, giving a baseline for future comparisons.
- Predictive analytics: While descriptive analytics lingers in the past, predictive analytics focuses on the future. The latter employs machine learning and mathematical modeling techniques to reveal potential trends and risks and answer the question, “What is likely to happen in the future?”
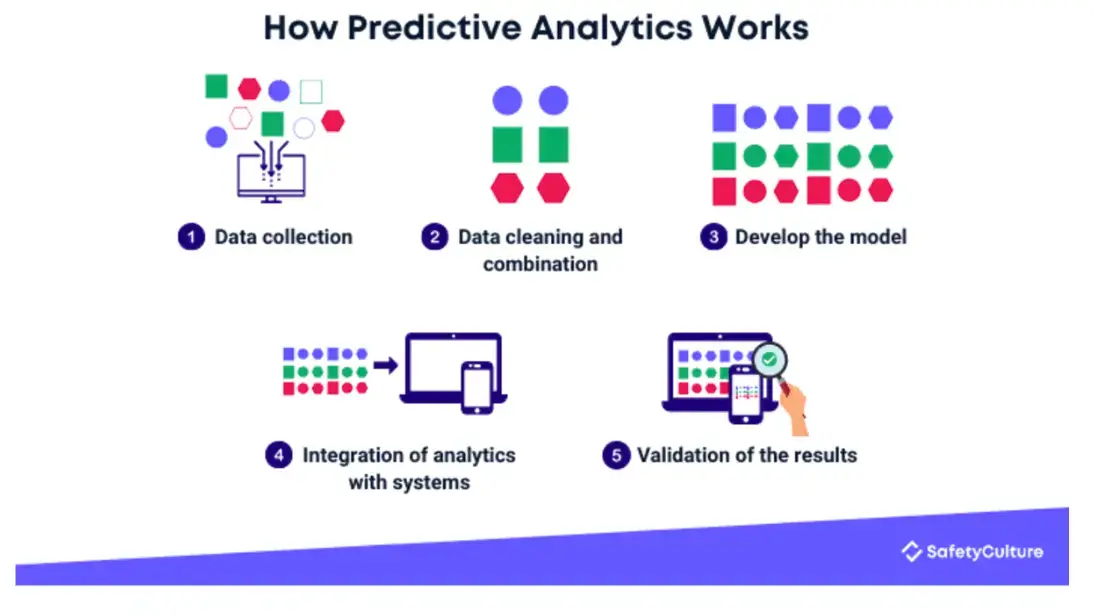
Source: SafetyCulture
- Prescriptive analytics: This is the most advanced type of data analysis. It uses results in predictive analytics and optimization techniques to recommend a course of action, answering the question, “What should we do in response?”
4. Presenting data and results
Don’t be that CEO with incomprehensible spreadsheets. Clear, compelling visualizations — charts, graphs, interactive dashboards — are vital for communicating insights to executives, stakeholders, and teams across your organization.
What is Business Intelligence (BI)?
Business Intelligence (BI) encompasses the tools, technologies, and practices that transform raw data into actionable insights to drive smarter, better-informed decisions.
If data analytics is the engine, BI is the sleek, intuitive dashboard that lets business users like you steer your company.
Understanding Business Intelligence Methods
Business intelligence systems leverage various technologies and practices to transform raw data into insights. Here’s how the process works:
- Data analysis
- Reporting
- Benchmarking
1. Data analysis
A typical BI process begins with gathering data from multiple sources, cleaning, organizing, and storing it in a centralized data repository.
Finally, business intelligence tools and techniques, including process mining, are used to analyze it and uncover hidden patterns, trends, and correlations—in short, data analytics.
2. Reporting
After analyzing the data comes reporting. Data analysis results are presented in a clear and intuitive format, such as charts, graphs, or interactive visualizations.
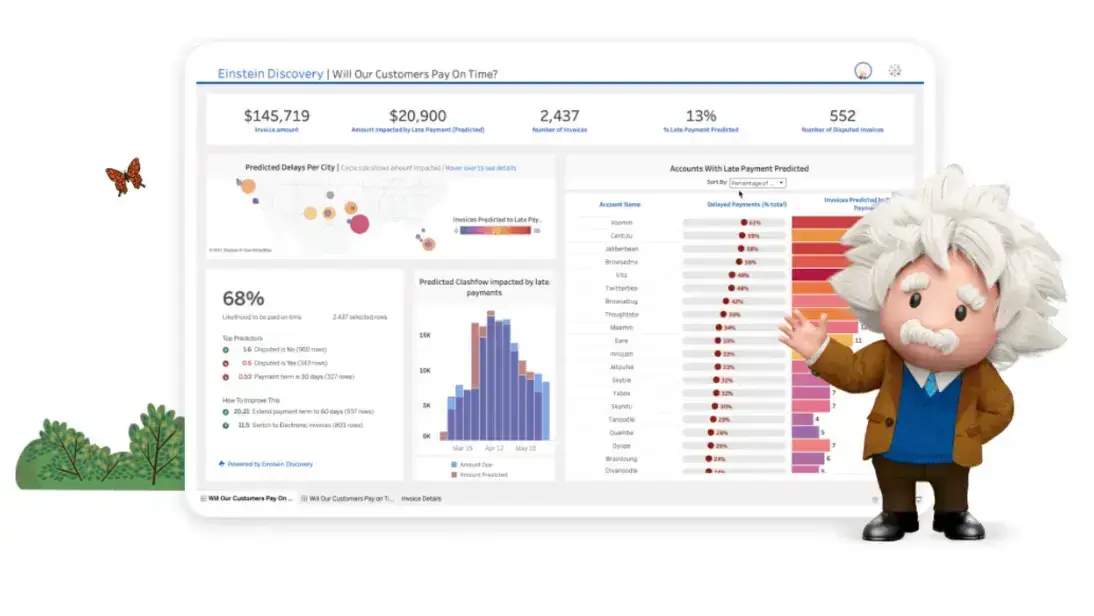
Source: Tableau
Reporting also implies taking regular snapshots of key performance indicators (KPIs), which helps you stay on track towards your goals.
Think of these reports as the gauges on your company’s dashboard. You can customize them to focus on specific departments, campaigns, or metrics.
3. Benchmarking
Benchmarking implies comparing your performance against industry standards or your historical data to identify areas for improvement.
Benchmarking can be a humbling exercise, but it’s essential for identifying areas where you can optimize your operations and close the gap between your current performance and your true potential.
How BI and Data Analytics Work Together
As you can tell from the previous sections, data analytics is an integral part of BI. Imagine a business intelligence system as a well-oiled machine.
Data analytics is the raw brainpower — the engine that processes information and generates insights about your data.
But these raw insights, in isolation, hold limited value.
That’s where the other parts of BI come in. They translate these abstract patterns into clear, actionable information tailored to your business.
BI correlates raw data with business strategies and goals, identifies which metrics to focus on, and presents the findings so everyone in your organization can understand them.
Without BI, even the most brilliant data analysis would struggle to create the real-world impact your company needs.
Then, BI is the translator, taking the raw data and packaging it in an actionable way for business leaders.
Importance and Key Benefits of Data Analytics and BI for Modern Businesses
Investing in data analytics and BI isn’t just a trend; it’s a survival tactic for businesses and business leaders in a hyper-competitive world.
The numbers don’t lie. The BI market will grow to over $30 billion by 2025.
With AI's increasing role in data-driven decision-making, many companies hire machine learning developers to build smarter, predictive analytics systems that drive business growth.
In 2020, more than two-thirds of companies embraced business intelligence solutions, and by 2023, more than a third of all large enterprises used BI to guide decision-making.
Here are a few reasons:
- Better decision-making: No more relying on gut feelings. BI and business analytics provide the clarity and confidence to make informed strategic choices.
- Enhanced customer understanding: Who are your most valuable customers? What motivates them? Data holds the key to deeper, more personalized relationships.
- Increased operational efficiency: BI helps identify bottlenecks, streamline processes, and ruthlessly eliminate waste based on what the data tells you.
- Discover new opportunities: Data may reveal untapped markets and niche segments or generate deeper insights into existing market trends you can exploit.
Data Analytics and BI in Action: Case Studies
Let’s look at two case studies to see how BI and data analytics play out in the real world:
-
Spotify and the Suggested Listening feature
Spotify’s algorithms are legendary. They analyze your listening habits, musical preferences, and playlist behaviors to tailor recommendations people love.

Source: Spotify
This is how Spotify describes tailored recommendations on their website:
“Spotify utilizes specialized algorithms to provide personalized recommendations that are tailored to each user. These algorithms curate and arrange content throughout the listener’s Spotify usage, including in Search, Home, and personalized playlists.” (Source: Spotify)
Recommendations based on data have had a massive impact on Spotify’s ability to achieve its business objectives.
Results showed improved customer experience, increased user engagement, stickiness on their platform, and a market share of over 31% of music streaming service subscribers.
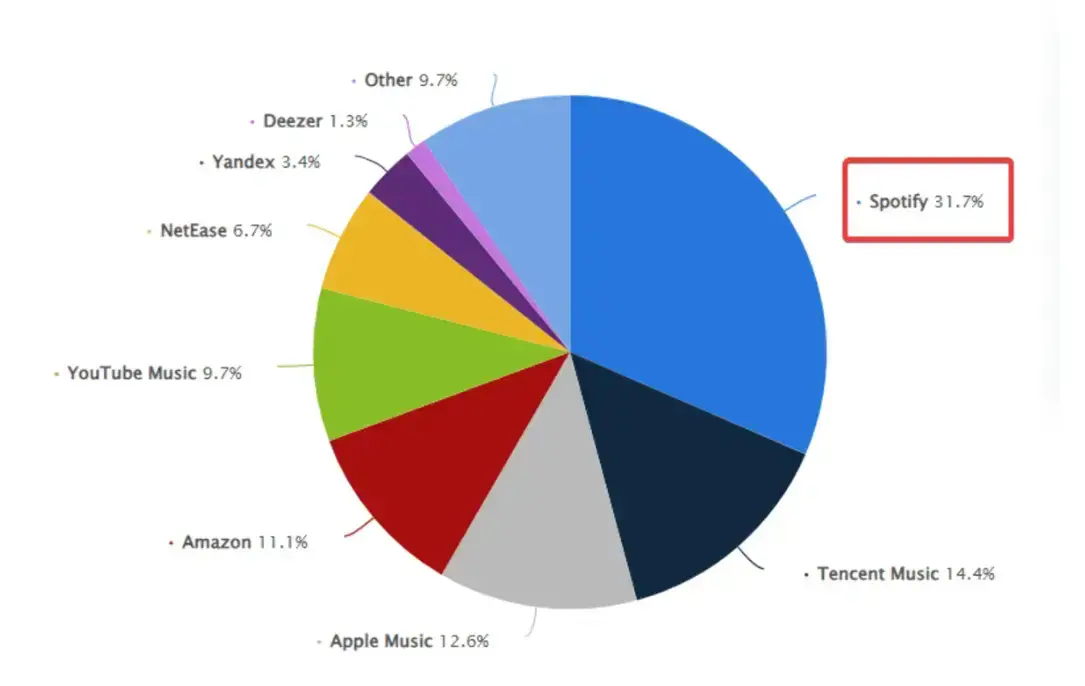
Source: Statista
-
Tesla: Driving innovation through data
Tesla cars are rolling data collection centers. Telematics data on everything from battery performance to driver behavior flows back for analytical processing.
This data allows Tesla to proactively identify potential issues, improve vehicle design, and push over-the-air software updates.

Source: Greencarreports
Tesla’s advanced analytics are a game-changer that’s improved customer satisfaction, driven innovation, and reinforced the brand’s technologically advanced image.
Beyond that, they empowered Tesla to develop its full self-driving autopilot feature.
Popular Data Analytics and Business Intelligence Tools
Selecting the right tools is crucial. Here’s a quick overview of the most popular business intelligence software tools:
- Microsoft Power BI: A leader in the space, known for user-friendliness and seamless integration with Microsoft’s suite of tools.
- Tableau: Powerful for advanced data visualization and exploration and handles large datasets well.
- Sisense: A strong choice for embedding analytics into your products and services, plus excellent dashboard customization.
- Domo: Excels at real-time data processing and mobile compatibility, focusing on ease of use.
- Qlik: An analysis tool offering a robust associative analytics engine that lets users freely explore data relationships and provide unique insights.
Getting Started with Data Analytics & BI: Step-by-Step Guide
If you’re new to all of this, it may seem overwhelming, but don’t let that fool you. The best way to approach data analytics and BI is with an iterative approach. Start small, learn, and grow from there.
To make data analytics more accessible, try using self-service BI tools. These tools simplify the report creation process without needing extensive technical knowledge.
Here’s how to get off the ground:
- Clearly define your goals
- Identify data sources
- Choose the right tools
- Start small
- Rinse, repeat, and expand
Step #1. Clearly define your goals.
Focus on the key questions your business needs answers to. What specific metrics do you want to track to improve decision-making? As in all business settings, you can use the SMART framework to set your goals.
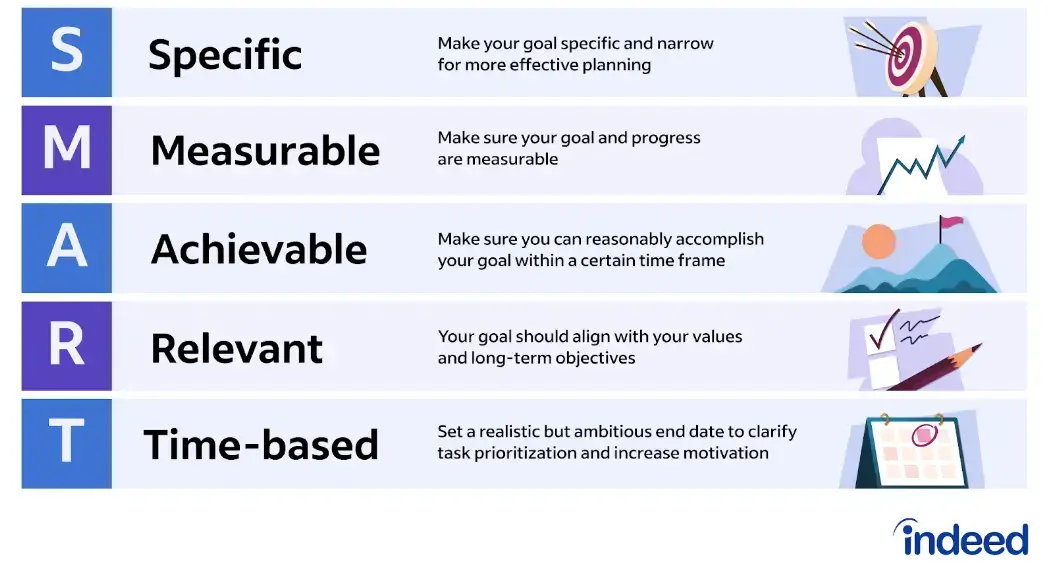
Source: Indeed.com
Step #2. Identify data sources.
Depending on your goals, you’ll need data from different sources. These sources could be customer relationship management (CRM) systems, sales reports, website analytics, social media, external market data, etc. This step might require collaboration with different teams within your organization.
Step #3. Choose the right tools.
Remember the overview we gave earlier. Do your homework. Research analytics software tools, get demos, and consider your budget, user-friendliness needs, and scalability requirements.
Step #4. Start small.
Don’t try to boil the ocean. Pick one or two key metrics you want to understand and impact. Focus on creating simple, actionable reports and visualizations. Once you have wins under your belt, you can expand your efforts and start digging into more complex analysis.
Step #5. Rinse, repeat, and expand
Data analytics and BI aren’t one-and-done projects. Establish regular reviews, analyze results, refine your approach, and gradually implement more sophisticated tools and techniques.
The Sooner You Start, The Better.
Data analytics and business intelligence are no longer luxuries. They’re now essential tools for staying competitive in an ever-evolving market.
Every day you wait is another day your competitors use their data advantage to get ahead. This is an important part of competitive intelligence.
Be bold and start, and don’t strive for immediate perfection. Take that first step – collect data, explore tools, and ask better questions about your business.
The insights you uncover will surprise you and empower you to make the courageous, transformative decisions that drive success.

Author Bio
With over 20 years of digital marketing and e-commerce expertise, Shane Barker founded TraceFuse. He is well-versed in the Amazon ecosystem and brand reputation management.
His insights have been featured on platforms like E-Com Engine Partner Spotlight and the 2 Sellers and a Microphone Podcast, highlighting his significant impact on these industries.