
In a sales team, it’s crucial to study your key metrics and understand how they affect revenue so that you can adjust the sales process if needed.
However, viewing metrics on a spreadsheet is cumbersome and frustrating, and hampers your ability to make timely data-driven decisions.
A sales metrics dashboard, on the other hand, helps you to visualize the data via simple charts and graphs. The bird’s-eye view allows fast, actionable insights, as well as the opportunity for deeper analysis.
In this post, we’ll explore the importance of viewing relevant metrics and show you how to develop and optimize your dashboard for maximum impact.
In this article:
- Understanding Sales Metrics
- Key metrics to track
- Choosing the right metrics for your business
- Key Steps in Creating an Effective Dashboard
- Plan and design your dashboard
- Develop and implement your dashboard
- Analyze and interpret sales data
- Optimize and maintain the dashboard
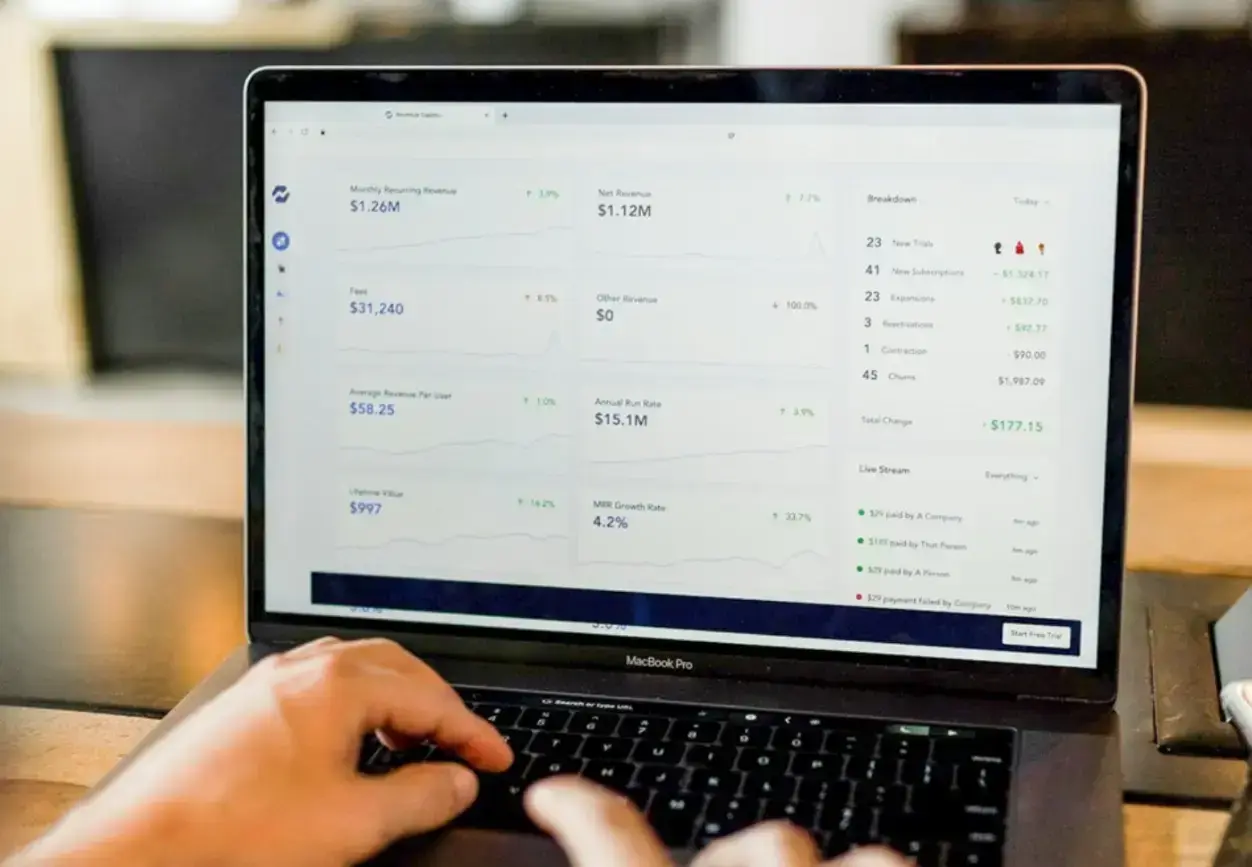
Free to use image sourced from Unsplash
Understanding Sales Metrics
Sales metrics are data points that measure the performance of individual sales reps, teams, or the business overall. These may be objective (sales rep productivity) or subjective (such as customer satisfaction scores).
Performance is typically measured against selected benchmarks or baselines, while the metrics are aligned with the company’s priorities.
Sales metrics enable you to track progress toward goals, identify any problems or bottlenecks, and highlight opportunities for revenue growth. Sales leaders can also use them to adjust compensation, reward top performers, and offer extra help where needed.
Working with executive compensation consultants can help businesses design competitive pay structures that attract and retain top talent.
Key metrics to track
The most important metrics will vary between different businesses, but here are some that most organizations will want to track. As you can see, sales managers have a lot to think about—which is why it’s helpful to visualize the numbers on a dashboard:
- Total revenue and average profit margin
- Revenue by product/service (shows product performance)
- Revenue from new customers (measured monthly or quarterly)
- Revenue from existing customers (shows levels of customer retention)
- Average deal size
- Year-on-year growth
- Customer acquisition cost (CAC)
- Average customer lifetime value or CLV (total revenue expected from a single customer during their relationship with your business)
- Net Promoter Score or NPS (measures each customer’s likelihood to recommend you)
- CSAT (customer satisfaction) scores
- Win rate (percentage of closed deals compared to the total number of opportunities)
- Conversion rate for each stage of the sales funnel
- Deals lost to direct competitors (shows where you need to improve)
- Average sales cycle length (be aware that this is longer for products such as SaaS)
- Average response time (how long it takes to respond to new sales leads)
- Percentage of qualified leads compared to total leads generated
- Quota attainment by individual or team
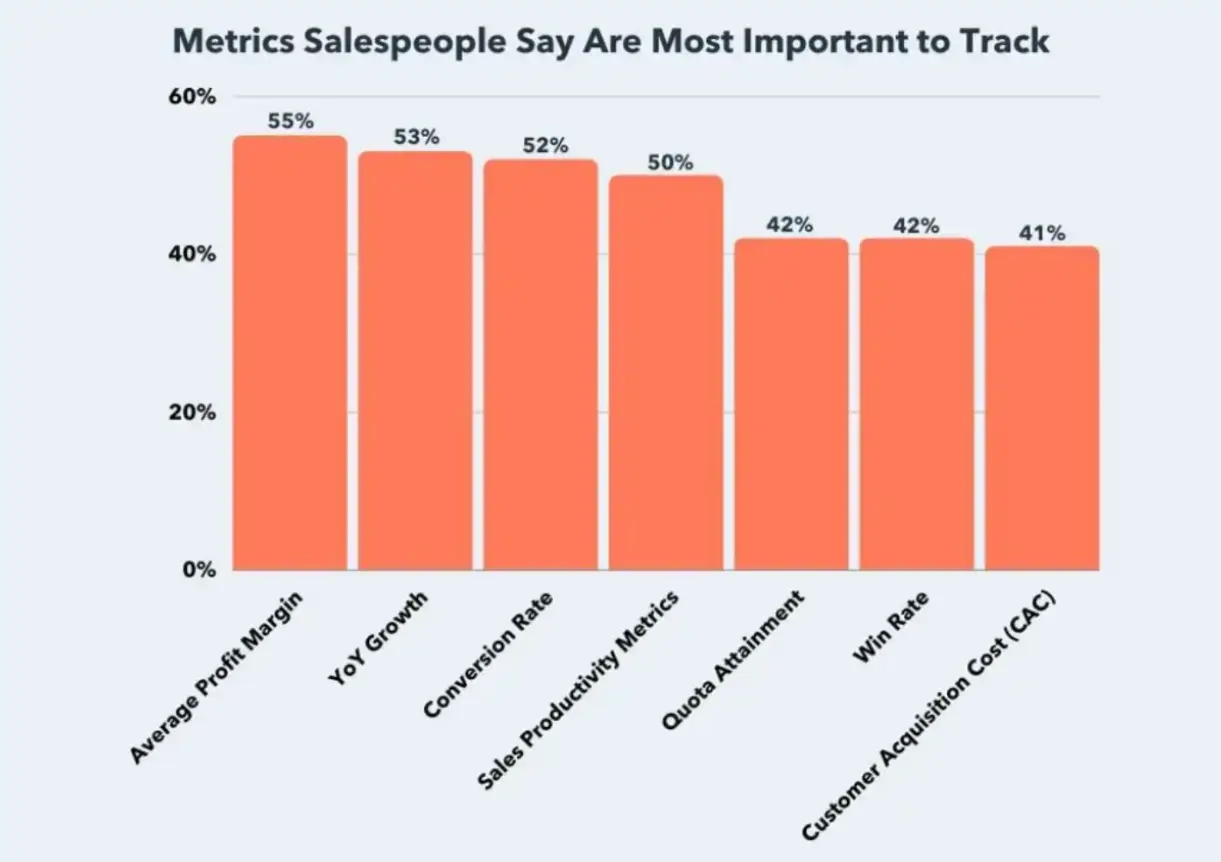
Source: HubSpot
Choosing the right metrics for your business
All those metrics would make for an overcrowded dashboard, and if you focused on them all, you’d have no time left for actual selling!
That’s why it’s so important to choose the most relevant ones for your sales team and your business goals, and focus on those.
For example, if your sales cycle is too lengthy, you can drill down into activity metrics to see where improvements are needed.
More specific metrics might include email open and click-through rates for a joint sales and marketing campaign, or revenue by partner if you’re collaborating with other businesses. You might choose to focus on sales recruitment with metrics such as average time to hire or staff turnover rate.
If your company relies on recurring revenue, such as subscription billing for SaaS, you’ll need to focus not just on the initial conversion but on keeping the customer long-term.
Metrics include monthly and annual recurring revenue (MRR and ARR), churn rate (customers who cancel their subscriptions), and average revenue per user.
These metrics are essential for calculating your SaaS magic number, a key performance indicator that measures the efficiency of your sales and marketing efforts in generating new revenue growth.
Key Steps in Creating an Effective Dashboard
The most effective way to view and analyze your chosen sales metrics is on a dedicated dashboard.
Often part of a CRM system or sales analytics software, sales metrics dashboards are interactive tools that pull in real-time sales data and turn it into a visual representation.
The idea is to provide an “at-a-glance” look at the key sales metrics, with the option to drill down into the specifics of a particular metric and generate a full sales report. Dashboards typically group related metrics together to show progress toward your sales goals.
So, how do you create a sales dashboard?
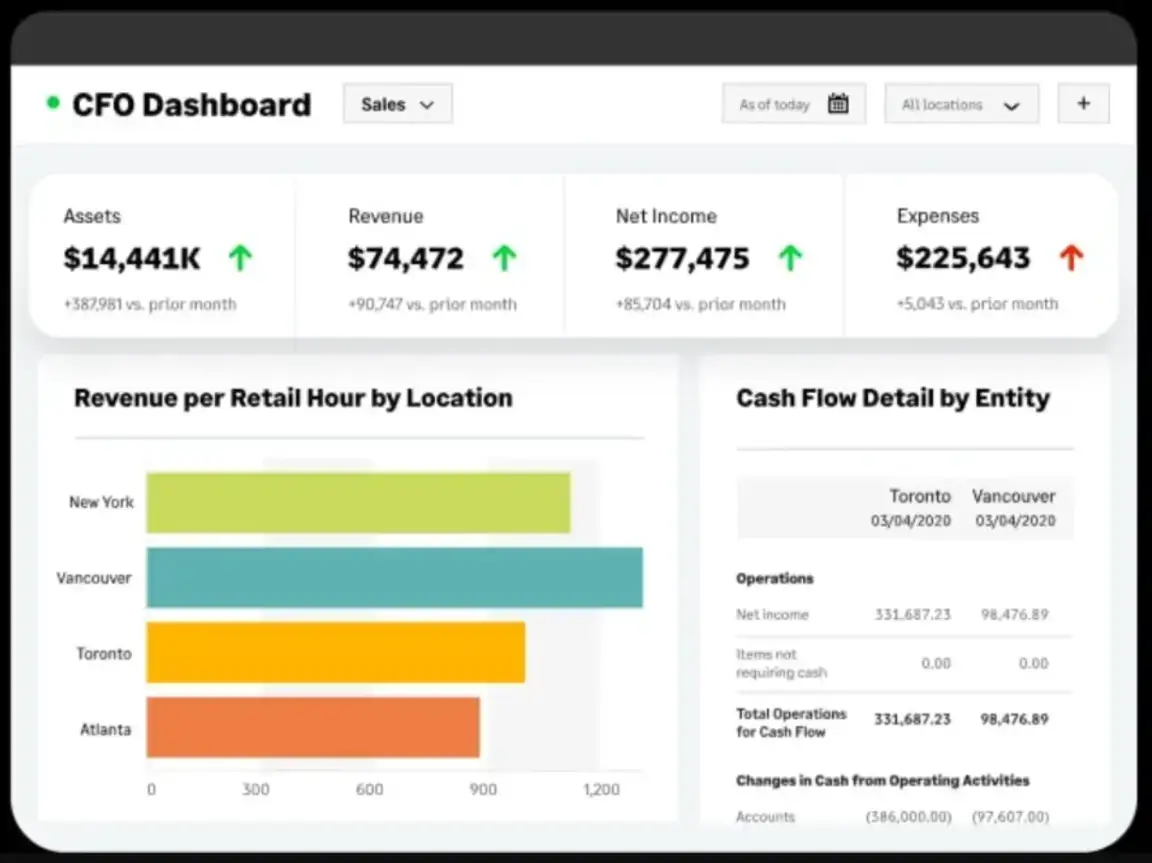
Source: Sage
Plan and design your dashboard
There’s no such thing as a one-size-fits-all sales performance dashboard.
We already mentioned the importance of choosing the metrics that are most relevant to your team and its goals, so the first step in planning a dashboard is to identify what you’re going to include.
You also need to consider who’s going to use the dashboard and how often they’ll look at it.
What information do you want them to see? Think about the amount of data you’ll include and the time period it’ll cover. For example, you probably don’t need metrics stretching back five or ten years.
It should be easy to customize to your needs and simple for the whole team to use. Make sure your solution can sync data from all relevant sources.
You can also save time by using pre-built dashboard templates and customizing them to match your team’s goals and reporting needs.
When you’re coming up with a design, remember to keep the layout as simple as possible. Users need to be able to understand and act on the information quickly, so sales performance data has to be relevant, accurate, and always up to date.
Develop and implement your dashboard
Once the dashboard is set up, you can start pulling in data from your various systems, such as your customer relationship management (CRM) platform, and select the charts and graphs you want to use.
Consider which would be most effective for different data sets, and what type of layout works best when viewed on a desktop or a mobile device.
Don’t try to show all the charts on one screen, as this will look too cluttered and make the information seem overwhelming.
Just display the most critical metrics—keeping them above the fold—and enable users to delve into them for deeper insights.
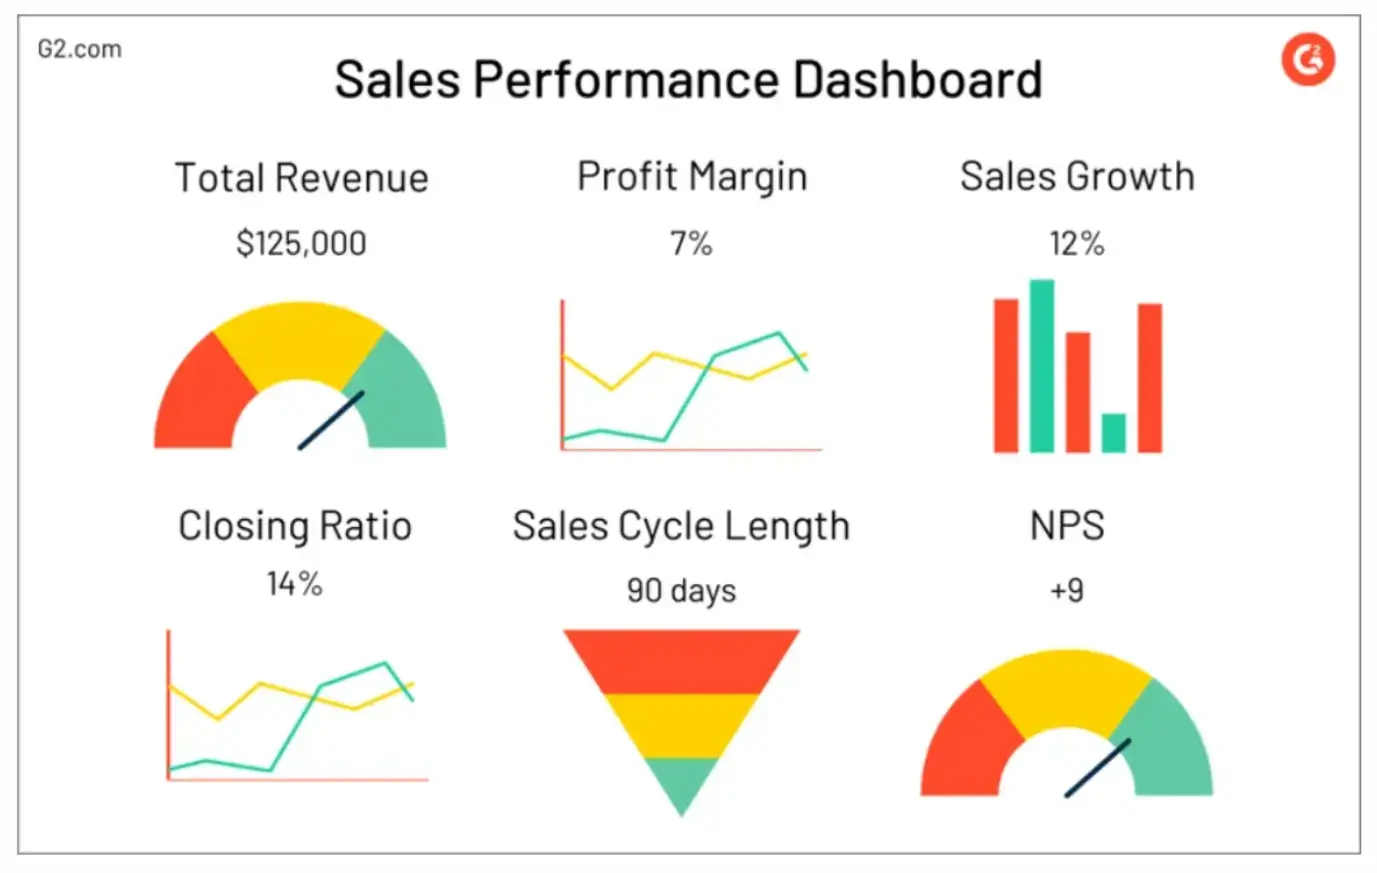
Source: G2
For instance, you might display a chart showing the current sales performance for the whole team, which people can click on to see results for individual sales representatives, customer segments, product categories, or sales by region.
The ability to share dashboards and reports across the business, perhaps via a secure collaboration tool, will help to encourage interaction and alignment between the sales and marketing teams.
Although dashboards are usually simple to use, it’s important to offer full training so that all team members understand what to do.
Analyze and interpret sales data
There’s no point in just following your sales metrics in the background. You need to use your dashboard to help you analyze and interpret the sales data on a regular basis.
That way, you can use the results to make improvements to your sales strategy and drive revenue growth.
For example, if the analysis shows that your sales executive has not met their targets for the past couple of months, you might need to offer extra coaching. If deals are taking too long to complete, you can look for bottlenecks in the sales pipeline.
As well as real-time data, sales metrics dashboards let you view historical sales figures so that you can make comparisons and set benchmarks. You should be able to identify trends and patterns over time and produce reports to share with C-level executives.
The best dashboards come with built-in analytics tools, but you can go a step further by integrating your CRM with your accounting software to see how your sales efforts are affecting the company’s overall financial health and cash flow.
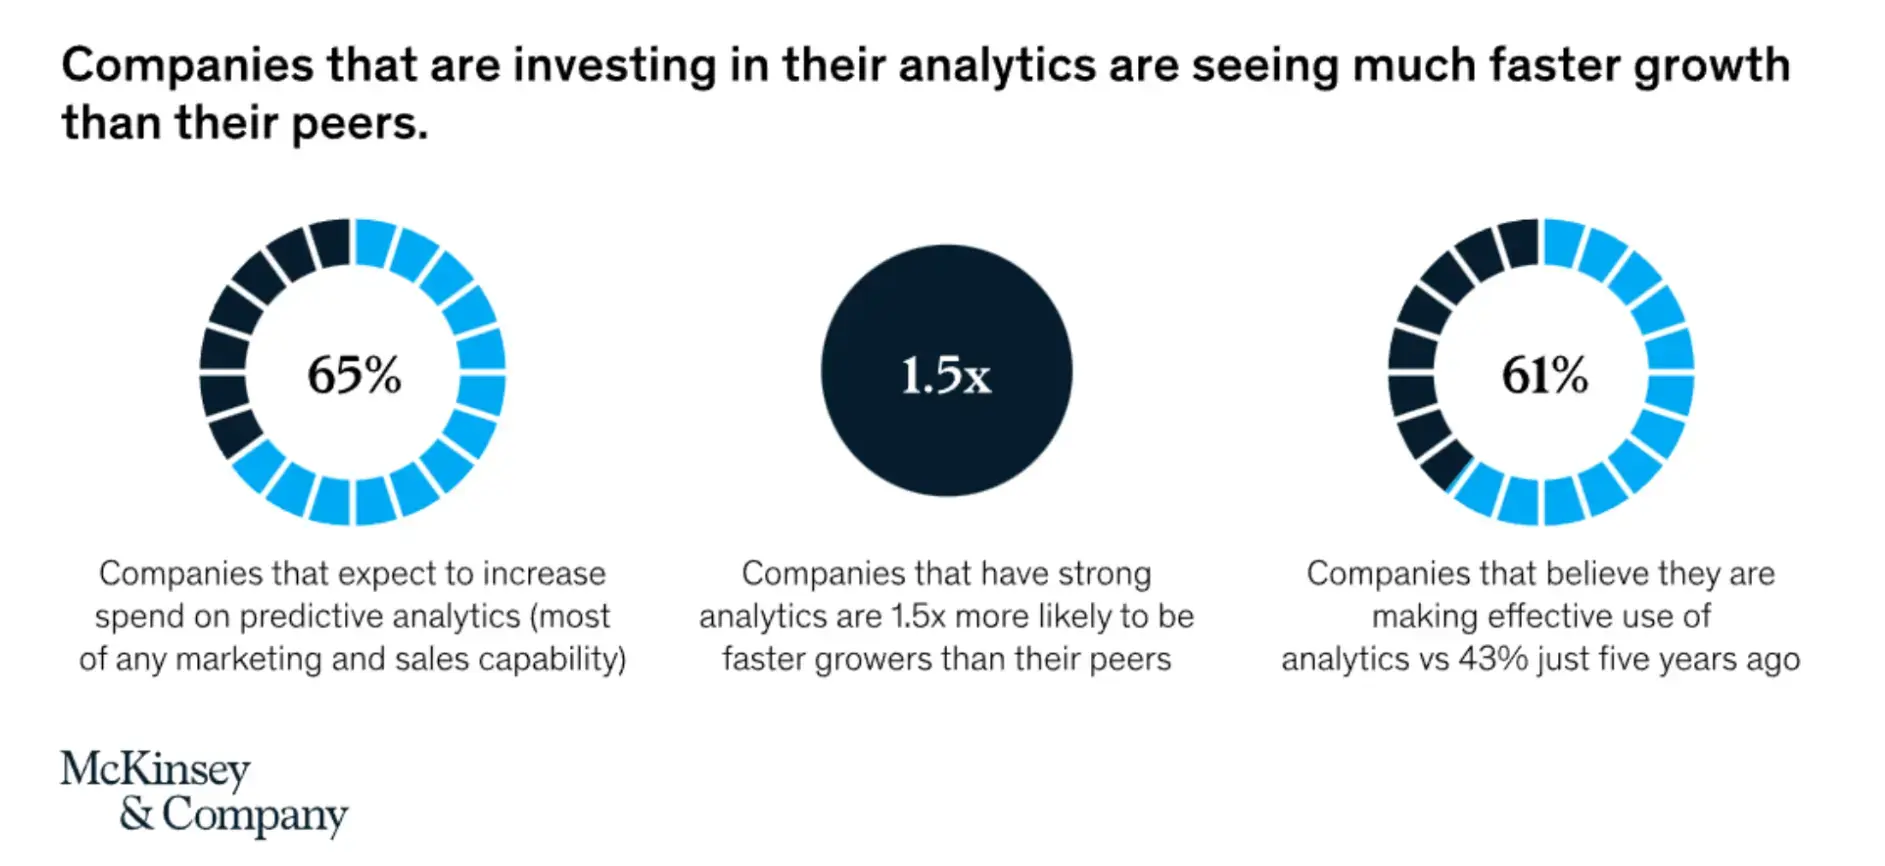
Source: McKinsey
Optimize and maintain the dashboard
A sales metrics dashboard isn’t a one-and-done thing.
To optimize performance and maximize sales opportunities, you’ll need to check that the dashboard is giving users the information they need, in the right format. You must get regular feedback from sales reps and leaders.
You can add or remove metrics as and when you need to, such as when you launch new products or if you make changes to your daily activities. A well-designed sales dashboard layout will adapt to your team and your evolving sales growth goals.
Key Takeaways
Sales metrics dashboards provide real-time insights and the data you need to make informed decisions. By displaying sales metrics in a digestible format, they offer a high-level view with the option of a deep dive into the details.
Start with a sales dashboard template or develop your own design, customizing the layout to show only the data that’s most relevant to your current sales operations.
With the right sales dashboard provider, you’ll also get analytics and reporting features to help you optimize your strategy for revenue growth.